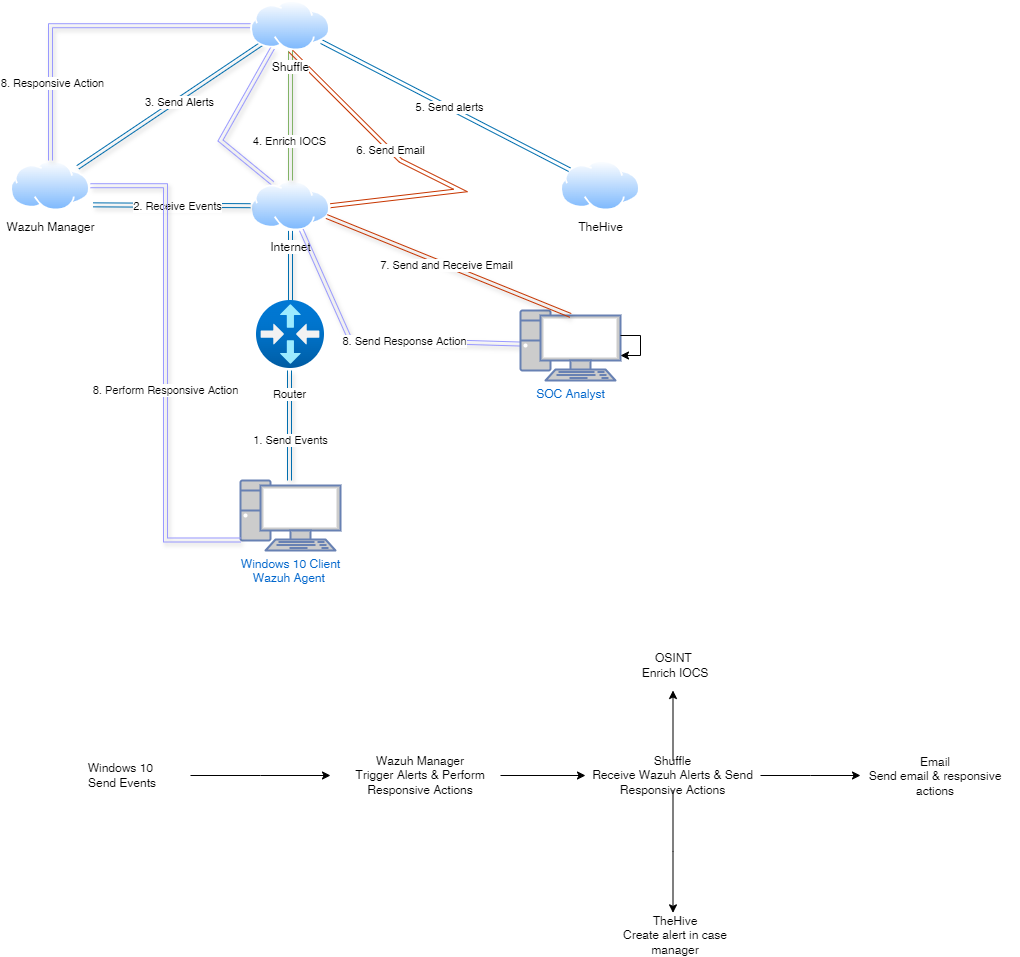
I would like to give a huge shoutout to @MyDFIR for the idea of this project!
First, we are going to be dealing with a tool called Wazuh. Wazuh is a cybersecurity tool that integrates SIEM + XDR capabilities. Comes with a load of features like Log Data analysis, Incident Response, Intrusion Detection and many more!
Second, we are also going to be using the The Hive in which it’s a 4 in 1 Incident Response tool. We will be using it as our case management tool!
Third, we will have a Windows 10 virtual machine with Sysmon installed.
Sysmon is a valuable tool for enhancing the security posture of Windows-based systems by providing detailed monitoring and logging capabilities essential for Incident Response and more. It will make logging data into Wazuh so much easier once we have our indexer agent installed. It will forward the events generated by Sysmon directly into Wazuh making the data easily visible to analyze.
First, we are going to begin by Installing VirtualBox and Installing Windows 10 into it. Next, we are going to download Sysmon straight from Microsoft’s website. Once, that’s done we are going to begin installing Sysmon .XML file. Once both are finished downloading we extract the zipped Sysmon file right in the Downloads directory. We are going to copy the file path for our next step.
From there we shall open Powershell with administrative privileges. We are then going to go over to run the following commands shown below:
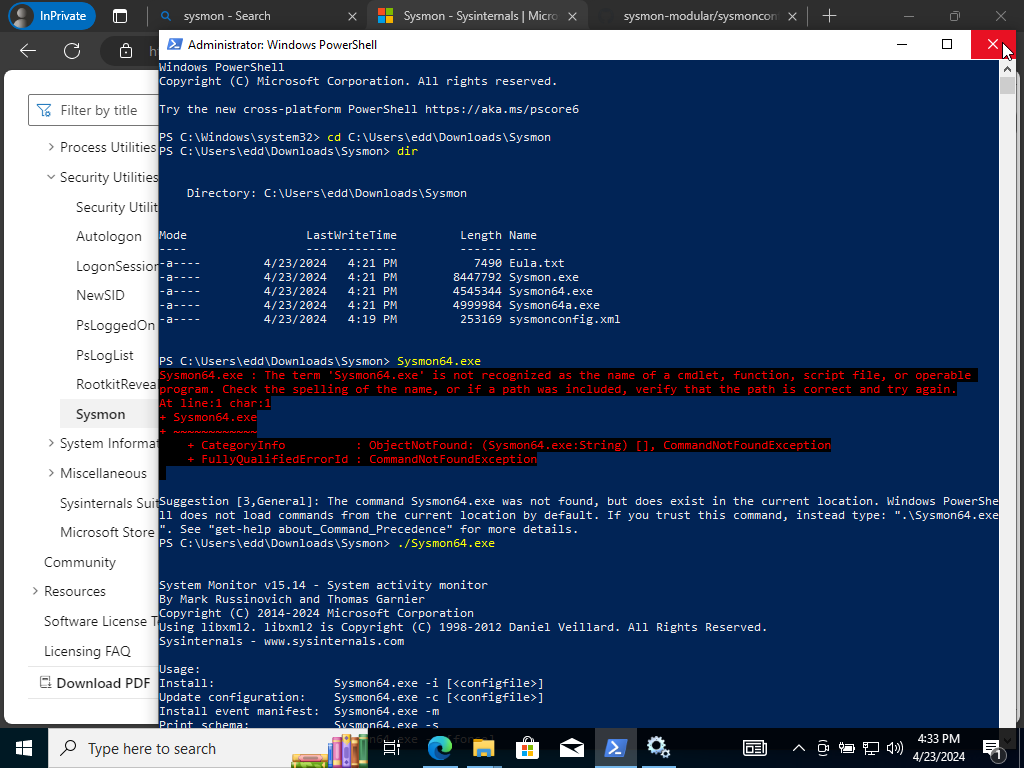
We are going to check our directory to make sure Sysmon executable and the configuration file is in there. Next, we are going to run the executable and we see that it doesn’t run but shows us the help command to guide us how to go about using Sysmon, confirming we don’t have Sysmon installed.
./sysmon64.exe -i sysmonconfig.xml
We may double check by running ‘Services & Event Viewer’.
- Click and type ‘S’ scroll down until we see Sysmon
- Application and Services>Microsoft>Windows>Click and type ‘S’
Once, we see it in there we are good to go! If, we click on Sysmon in Event Viewer and click on ‘Operational’. We see a ton of telemetry!
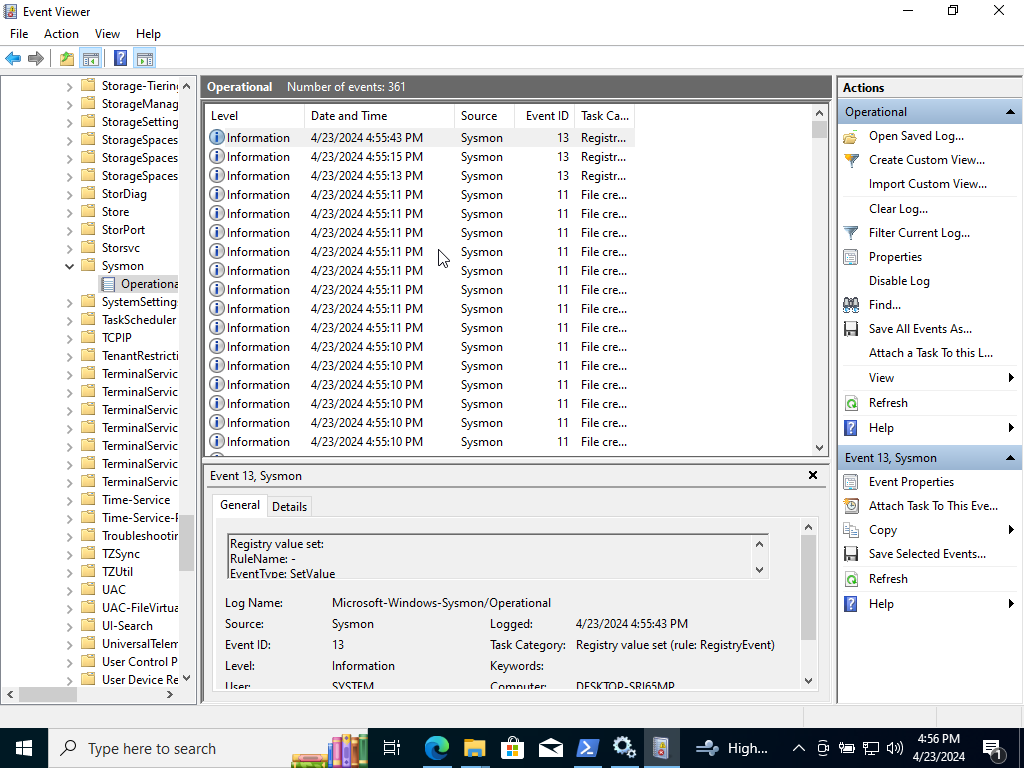
Now that we have Windows 10 installed with Sysmon we can go ahead and detect malicious activity!
Next, we are going to install Wazuh via Digital ocean. Create a new droplet and select the region closest to you, in my case it’s San Francisco. We shall then proceed to select an Ubuntu image running on 22.04 LTS x64.
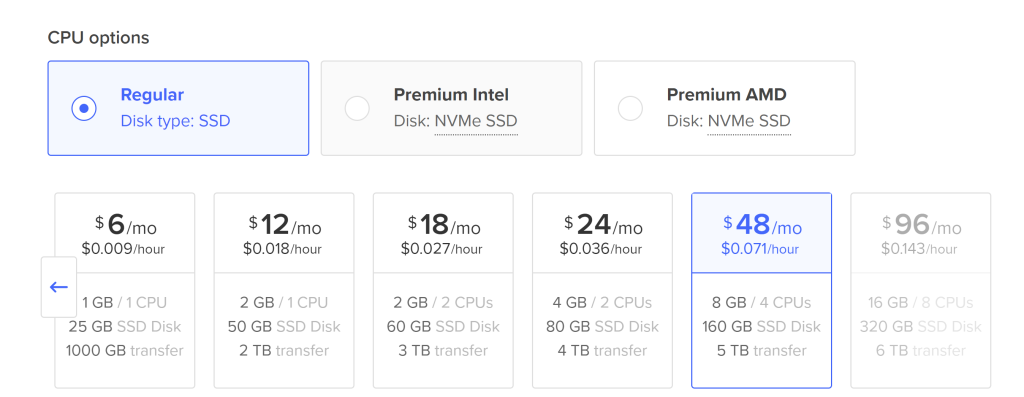
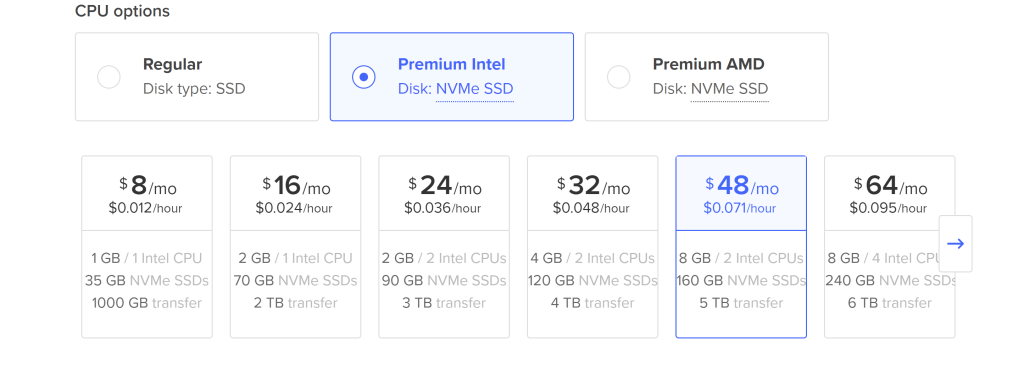
Requirements is at least 8GB ram and 50gb of Disk space which the 48 dollar plan should provide. Since, we on $200 credit free trail we are okay.
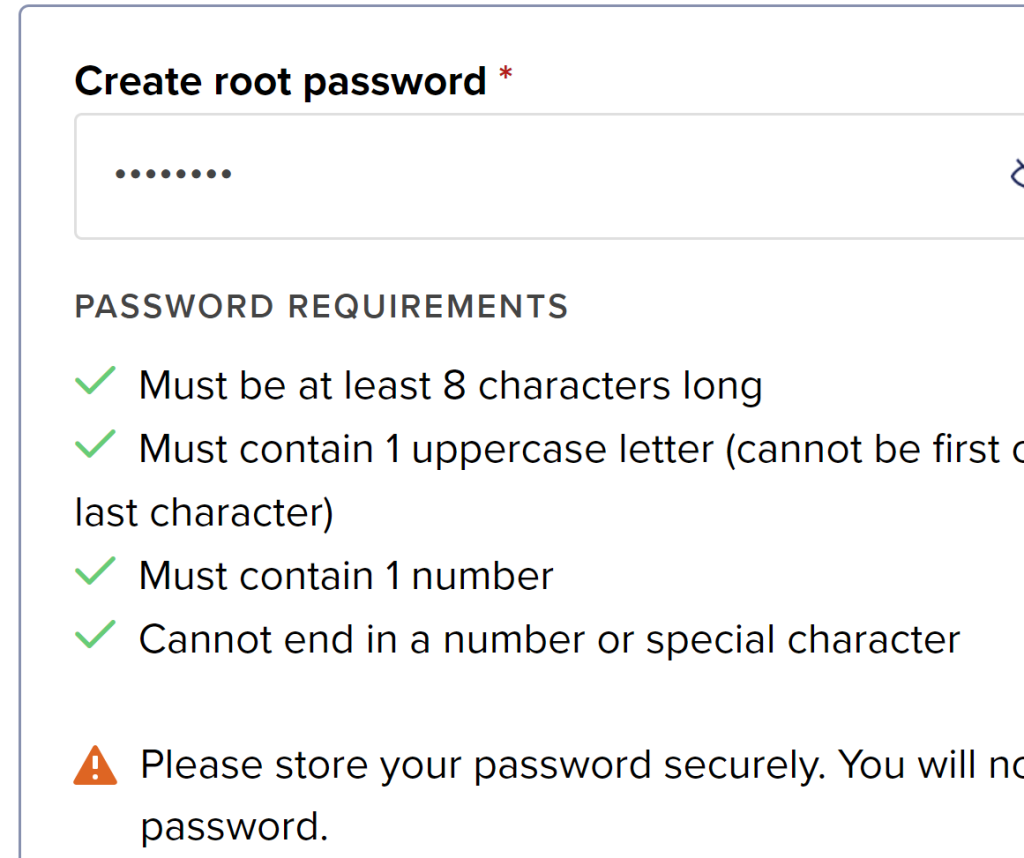
Let’s go ahead and create our root password for the targetr. Scroll down and change the hostname to ‘Wazuh’. Lastly, click “Create Droplet.” Give it some time to generate. Meanwhile, hover over to Networking on the left side.

Now, hover over to the “firewall” tab. Begin, creating our firewall.
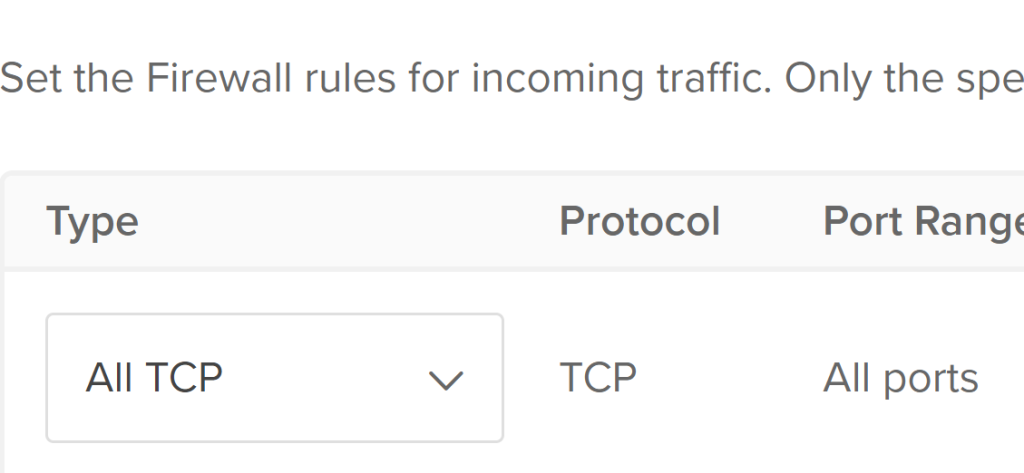
Change our Inbound to “All TCP” ports and only specify our IP address to be able to access our droplet. We can do a look up in our search engine, “What is my IP address”? It should provide it to you just copy and paste it into our firewall configuration. We will want to do the same for UDP just in case. Scroll down and click on “Create Firewall.” Once our firewall is created we can start adding our virtual machine to it.
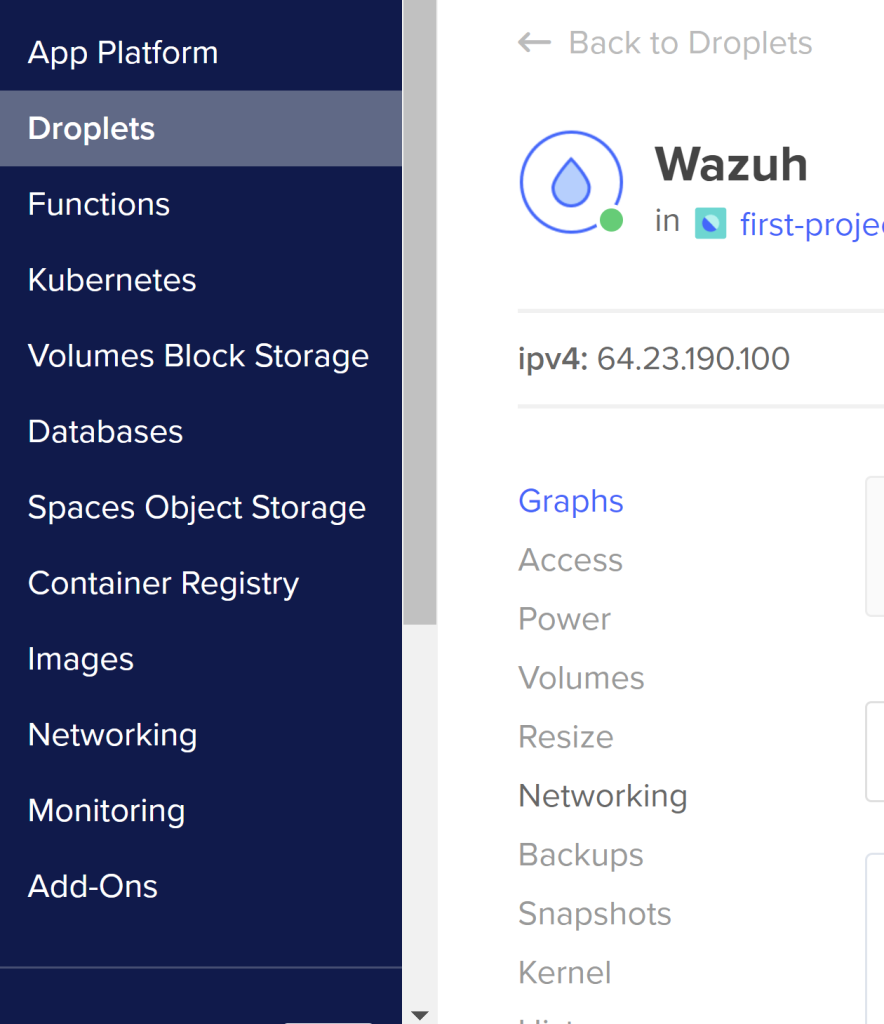
On the left hand side, Click on Droplets and Click on our newly created Wazuh droplet. Inside the droplet let’s click on Networking. Scroll down until you see Firewalls. Click “Edit” It will show the newly created firewall we just created click on it. Scroll over to our droplet tab and click “Add Droplets.”
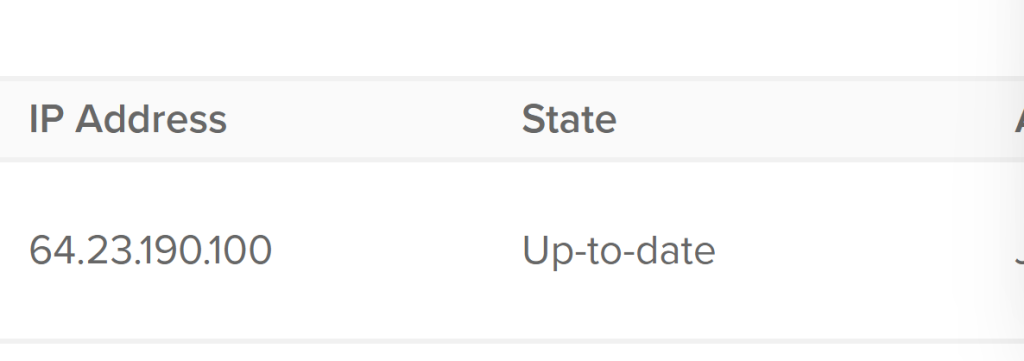
It should’ve successfully been added and should be up to date.
Under, the droplets tab and under Wazuh. Click on the Access tab within the droplet. There will be a droplet console to allow remote access to our Virtual Machine.

Click “Launch Droplet Console”. Give it time to connect to droplet. Once, we have successfully connected via SSH.
Note: I was personally having issues with droplet console in DigitalOcean I instead decided to SSH into Powershell instead.
ssh root@<IP address of droplet>
Since, we are already in root we can run:
apt-get update && apt-get upgrade -y
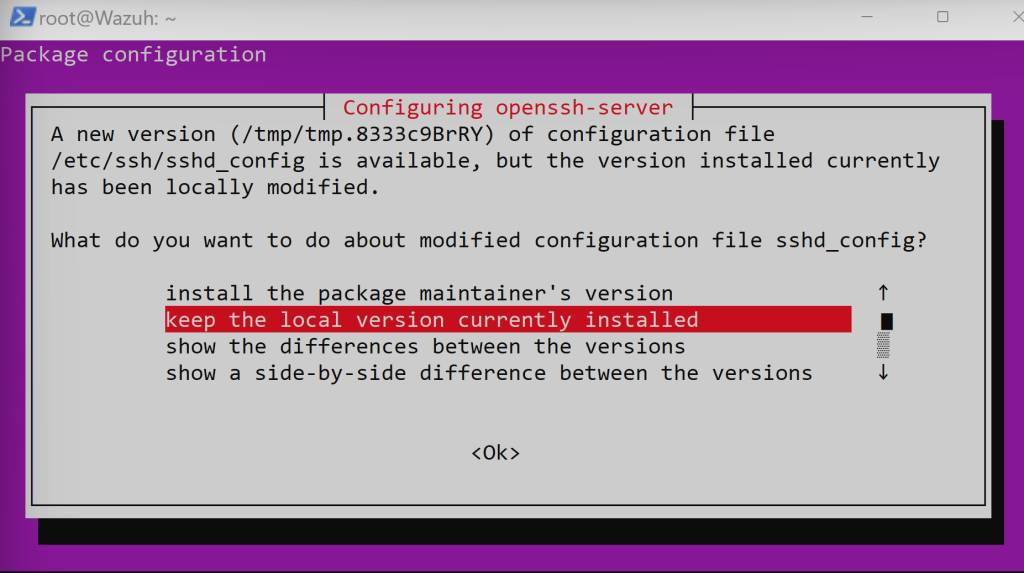
Press enter. Again it will ask you which services you would like to run again hit enter. Once, finished we may begin with the installer of Wazuh.
Which, can be found on Wazuh’s website for reference.
curl -sO https://packages.wazuh.com/4.7/wazuh-install.sh && sudo bash ./wazuh-install.sh -a
Give it a couple minutes for Wazuh to install. Once it’s finalized it will display the username and password to access Wazuh dashboard. Make sure to document the credentials within a notepad or password manager for the remainder of the lab.
In order to login into Wazuh we must copy our server’s public IP address. Afterwards within our browser let’s paste in our Server IP via:
https://<server IP>
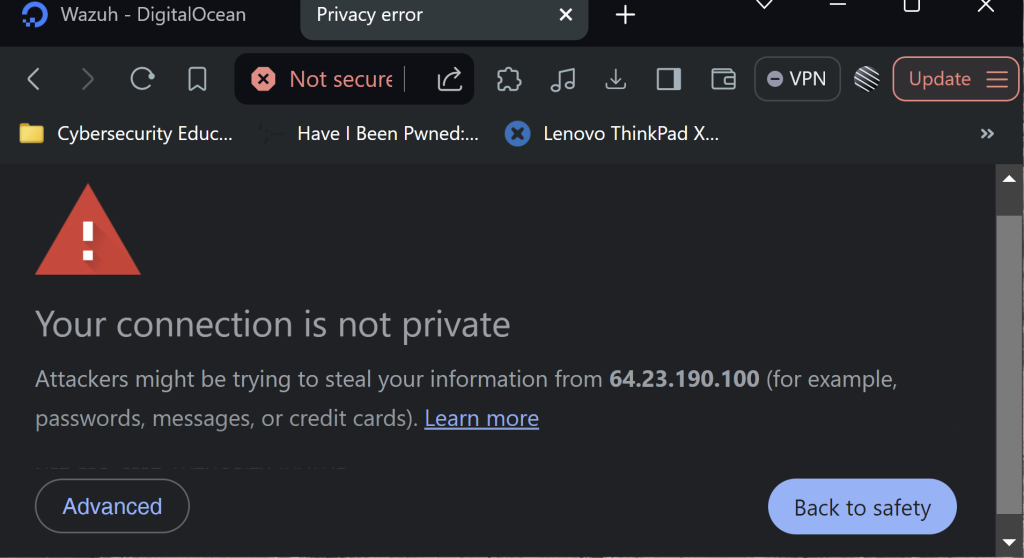
It will prompt you that the connection is insecure. That’s okay click on ‘Advanced’ and click on ‘Proceed to <Server IP>(unsafe)’. It should redirect us to Wazuh’s dashboard. We are in! >:)
Last, is to install and configure TheHive. Let’s go back into DigitalOcean and hover over to Create in the top right corner. Click on it.
We will want to click the Server in the region closest to us.
Scroll down to choose an image. We will go with Ubuntu 22.04 LTS x64 like before.
Scroll down again to Sizes and we will go with these allocated resources.
Keep scrolling down until we get to “Choose Authentication Method.” From there we will set our root password again like before. Document the credentials in a notepad or password manager for future reference.
Once, that’s done we will scroll down and change our hostname to the “thehive.”
Last, we will want to click on ‘Create Droplet’.
Next, let’s make sure we place the “thehive” droplet we just created into the firewall we had created before.
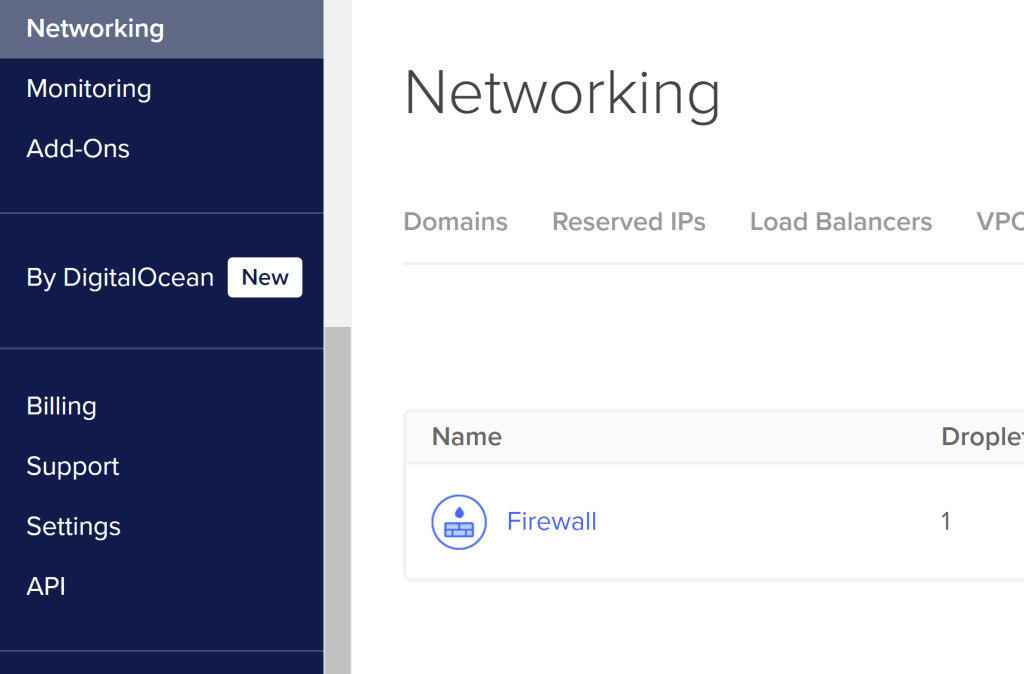
Click on our recently created Firewall.
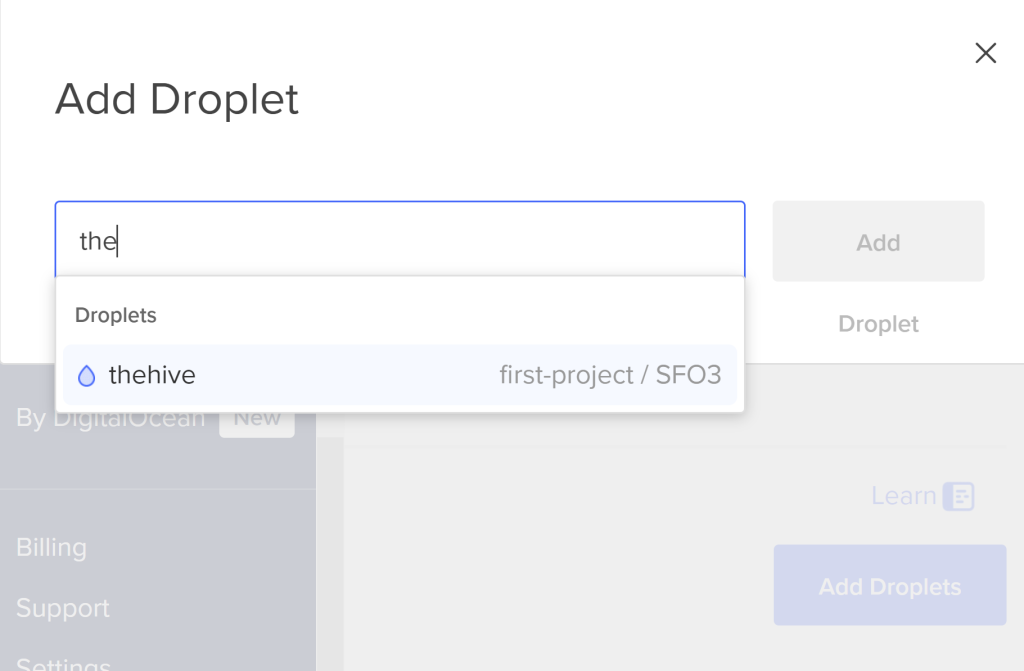
Click on the Droplets tab. It should show a button to “Add Droplets.” Click on it and search up “thehive” droplet we just created. Add the droplet to our firewall. Sweet! We should get a prompt we updated our firewall successfully! We can verify it by going back to our firewall and our newly created “thehive” droplet should be there.
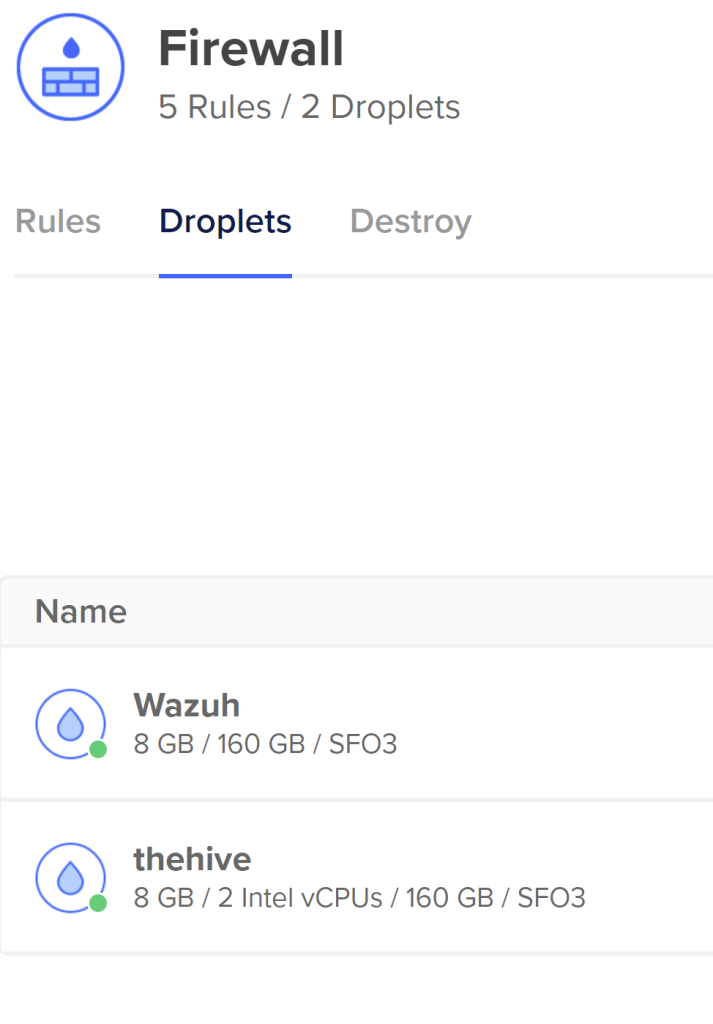
Note: I am going to be using Powershell again to SSH since the DigitalOcean console is giving me issues. Remember to copy the thehives server public IP.
ssh root@<Server IP>
Once, we are in let’s copy and paste TheHive’s prerequisites by running:
apt install wget gnupg apt-transport-https git ca-certificates ca-certificates-java curl software-properties-common python3-pip lsb-release
Once, the prerequisties are done installing we are next going to be installing 4 components: Java, Cassandra, ElasticSearch, lastly TheHive.
Note: Run each command one at a time it will not run the commands together in Powershell.
First up we are going to install Java by running the command below:
wget -qO- https://apt.corretto.aws/corretto.key | sudo gpg –dearmor -o /usr/share/keyrings/corretto.gpg
echo “deb [signed-by=/usr/share/keyrings/corretto.gpg] https://apt.corretto.aws stable main” | sudo tee -a /etc/apt/sources.list.d/corretto.sources.list
sudo apt update
sudo apt install java-common java-11-amazon-corretto-jdk
echo JAVA_HOME=”/usr/lib/jvm/java-11-amazon-corretto” | sudo tee -a /etc/environment
export JAVA_HOME=”/usr/lib/jvm/java-11-amazon-corretto”
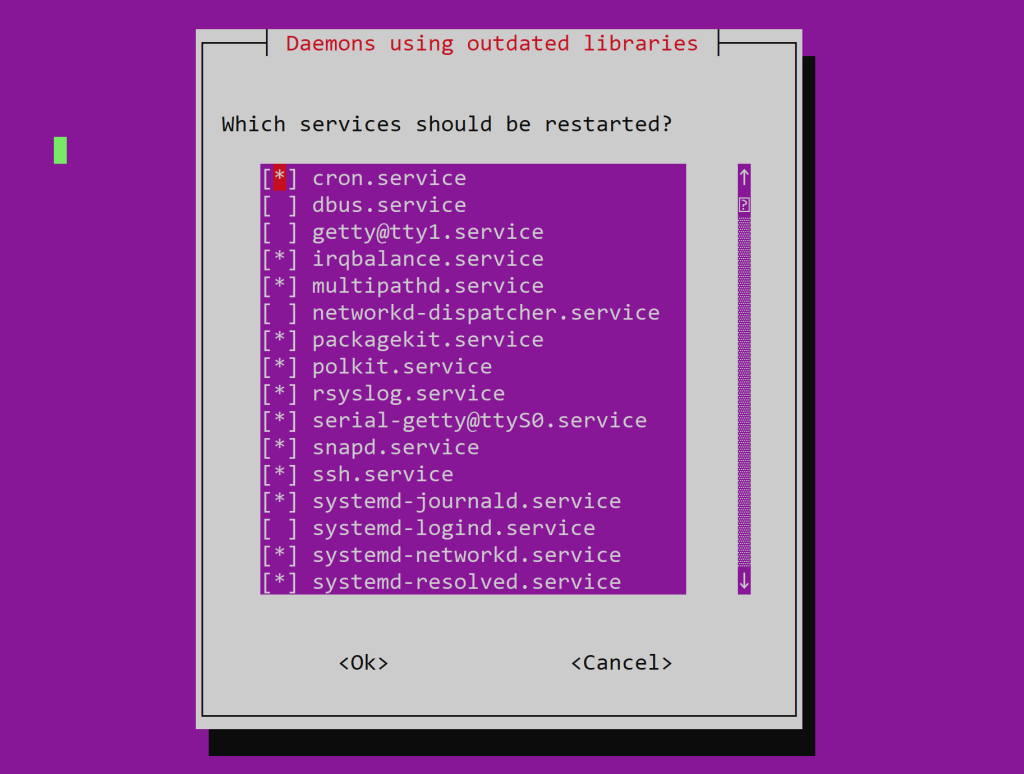
Press Enter.
Next, we are going install Cassandra running the following command below:
wget -qO – https://downloads.apache.org/cassandra/KEYS | sudo gpg –dearmor -o /usr/share/keyrings/cassandra-archive.gpg
echo “deb [signed-by=/usr/share/keyrings/cassandra-archive.gpg] https://debian.cassandra.apache.org 40x main” | sudo tee -a /etc/apt/sources.list.d/cassandra.sources.list
sudo apt update
sudo apt install cassandra
Third, install ElasticSearch by running the following command shown below:
wget -O- https://archives.strangebee.com/keys/strangebee.gpg | sudo gpg –dearmor -o /usr/share/keyrings/strangebee-archive-keyring.gpg
echo ‘deb [signed-by=/usr/share/keyrings/strangebee-archive-keyring.gpg] https://deb.strangebee.com thehive-5.2 main’ | sudo tee -a /etc/apt/sources.list.d/strangebee.list
sudo apt-get update
sudo apt-get install -y thehive
After, they have all successfully installed. We shall go ahead and configure them so they may work together seamlessly.
First, we will want to configure Cassandra in “thehive” server
nano /etc/cassandra/cassandra.yaml
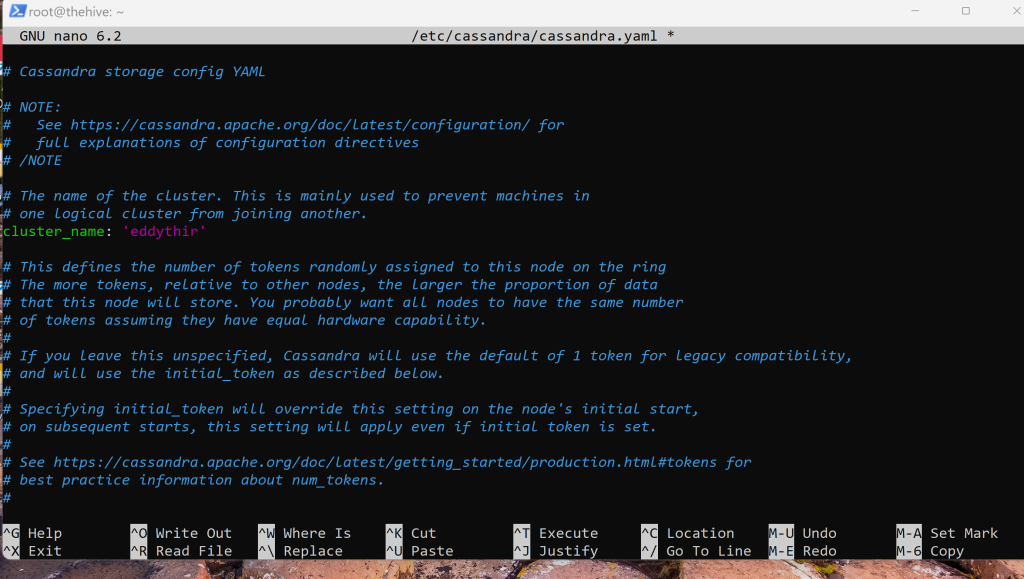
Replace the ‘clustername’ with a name of your choosing in my case, it’s ‘eddythir’.
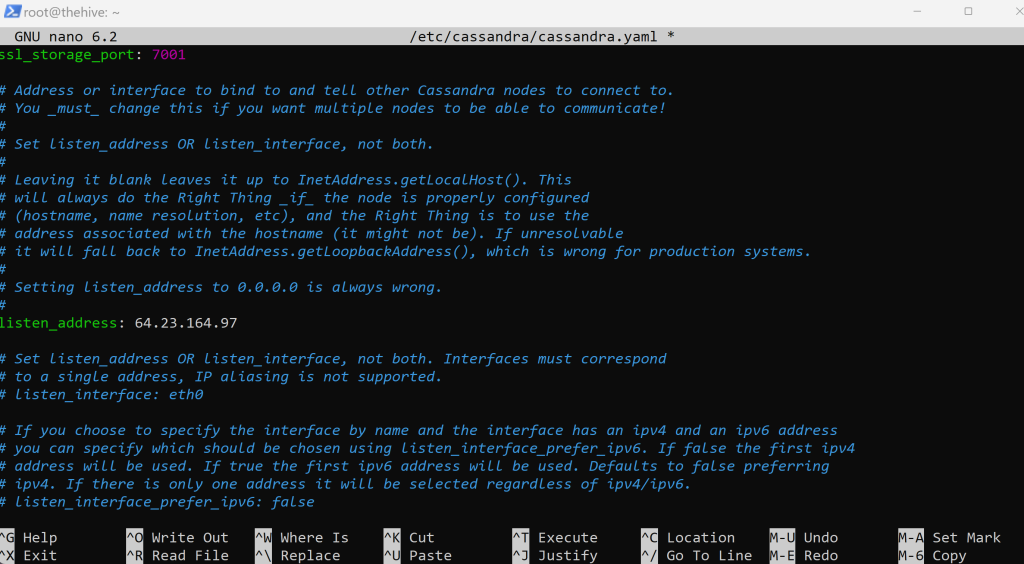
ctrl+w and search listen_address
Change it to our ‘thehives’ public IP address. Do the same for rpc_address.
ctrl+w and search rpc_address
Change it to our ‘thehives’ public IP address again. Do the same for seed_provider.
ctrl+w and search seed_provider
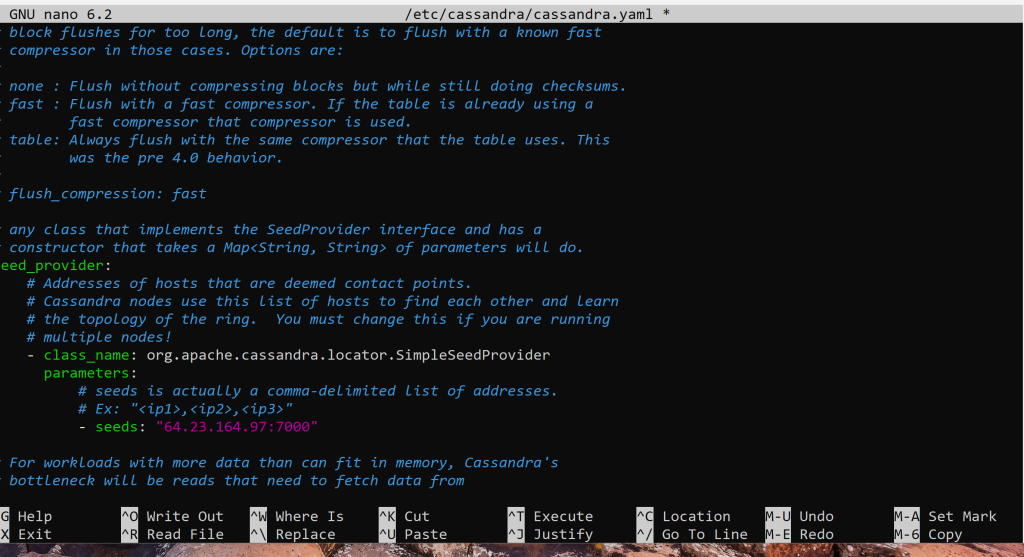
Change the default address with our servers public IP address. By also, keeping the default port :7000. Save it by using;
ctrl+x and it will prompt you to overwrite the file type y for yes
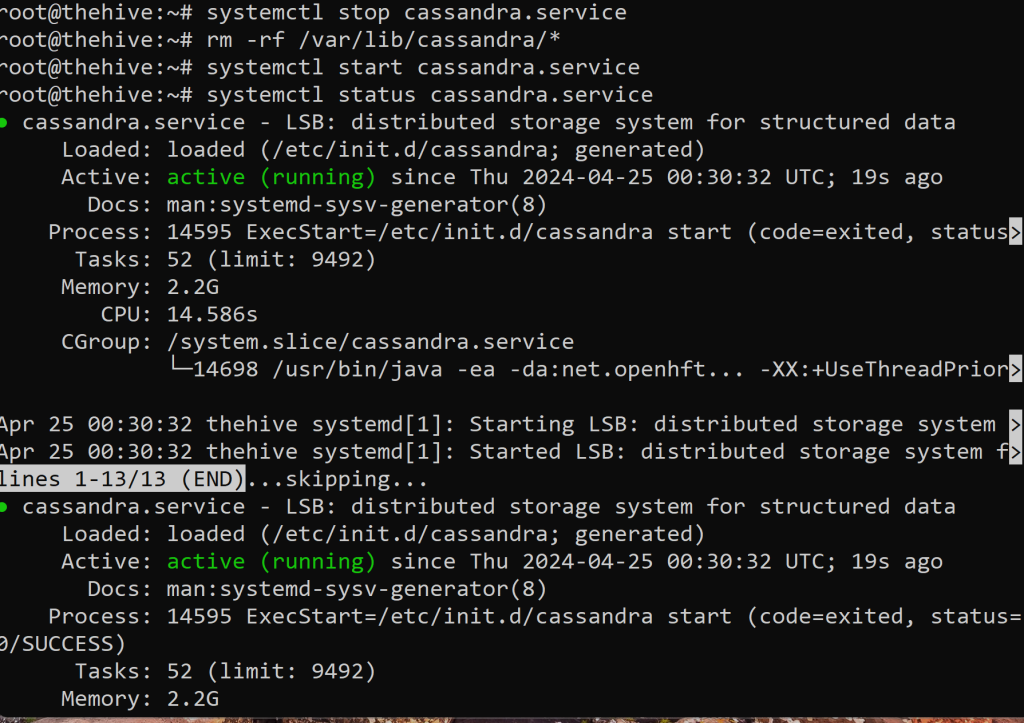
First we are going to stop the Cassandra service with first command shown above. Second, we are going to delete all files in the /var/lib/cassandra/ directory. Third, we are going to restart the service using the third command. Last, its a good habit to check if our desired Cassandra service is running by using the last command shown above. We see that it’s active and running. Sweet!
Next, we are going to configure the configuration files for ElasticSearch.
nano /etc/elasticsearch/elasticsearch.yml
Once, in scroll down and remove the comment on ‘cluster.name’.
Let’s change it to “thehive.”
Scroll down again and remove the comment on ‘node.name’.
We shall leave it as ‘node-1’.
Scroll down even more and remove the comment on ‘network.host’.
Delete the current host IP and input thehive’s public IP address.
Scroll down a bit after that and remove the comment on ‘http.port:9200’.
Scroll down a bit more and remove the comment on ‘cluster.initial_master_nodes:’.
Remove “node-2” and just leave “node-1”.
cluster.initial_master_nodes: [“node-1”]
It should look like this. We don’t need to scroll any further because there is no need to scale in a demo environment. Let’s save it.
Next, let’s start by starting the elasticsearch service.
systemctl start elasticsearch
Next, enable it by running the following:
systemctl enable elasticsearch
Lastly, we will want to check the status of elasticsearch to verify it’s running.
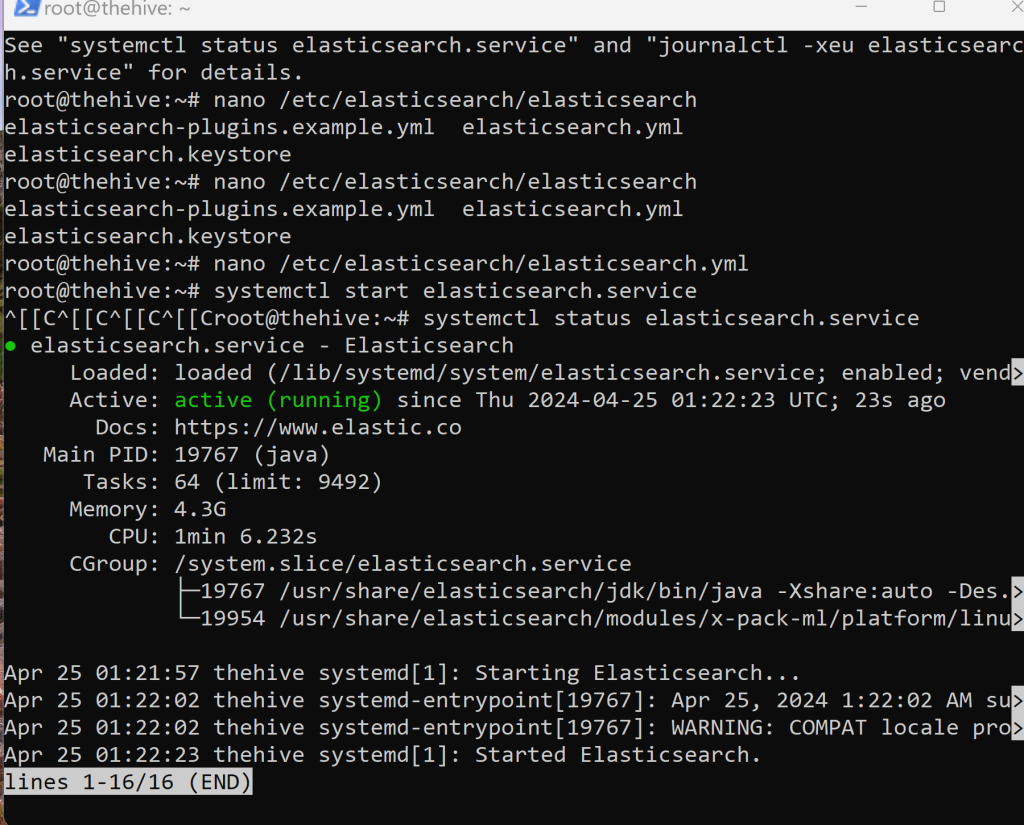
Here’s how it should look like!
Note: It will look all over the place because I had to troubleshoot .yaml file because I forgot to remove the comment on the cluster master nodes and remove the second node. Afterwards, worked fine :).
Let’s also, double check Cassandras service because it randomly stops on it’s own at times. Remember it’s important to get into that habit of actually checking periodically that the services are running.
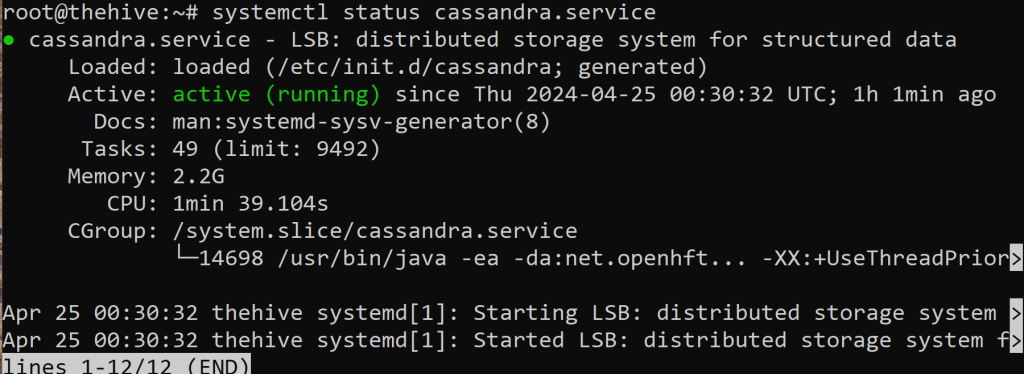
Lovely she’s running! Next, we will want to get into configuring the configuration files for TheHive. We want to make sure a specific user and group have access to a certain file path.
Note: Remember our Powershell command didn’t install TheHive in the beginning. We must manually reinstall TheHive.

We will then ls -la into the /opt/thp directory. It will show us file permissions for the root user. We will then want to change those permissions to user & group ‘thehive’ recursively within the /opt/thp directory. We shall then proceed to nano into applicaiton.conf file to change it’s configurations. Scroll down a bit until you see…
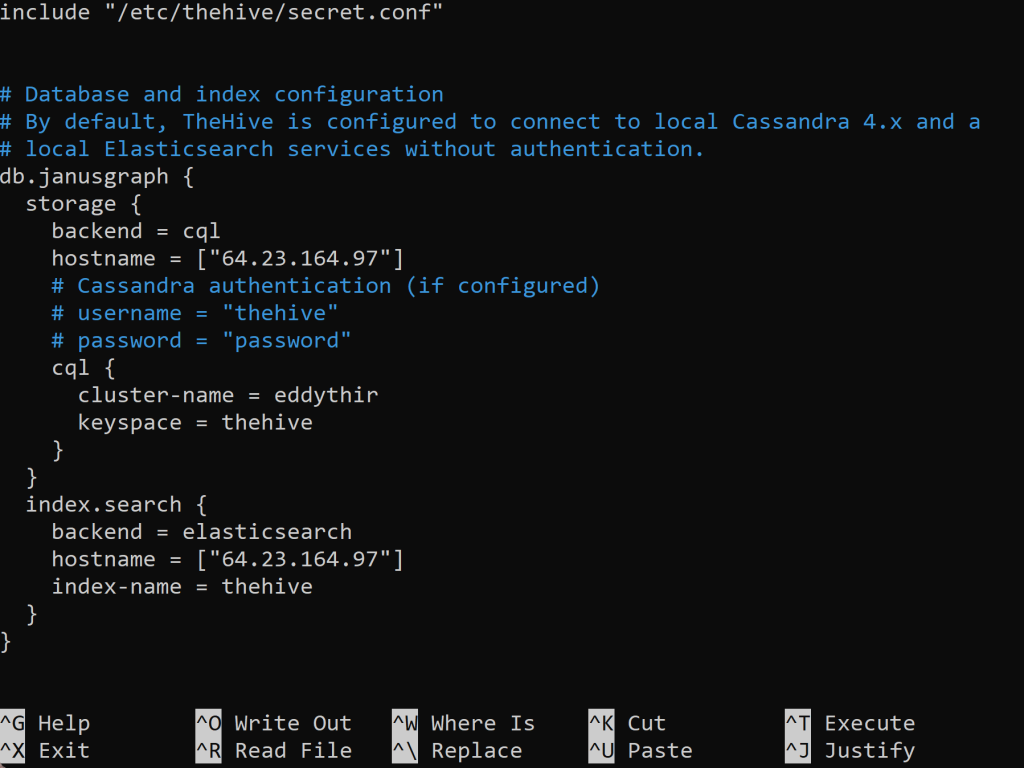
Change both hostnames shown above to our ‘thehive’ public IP address. Also, change cluster-name to the cluster-name to the one previously.
Scroll down a bit. We see that…

Since we changed the file permissions to the user & group ‘thehive’. Now, we have access to the local files belonging to the TheHive.
Scroll down a bit more.
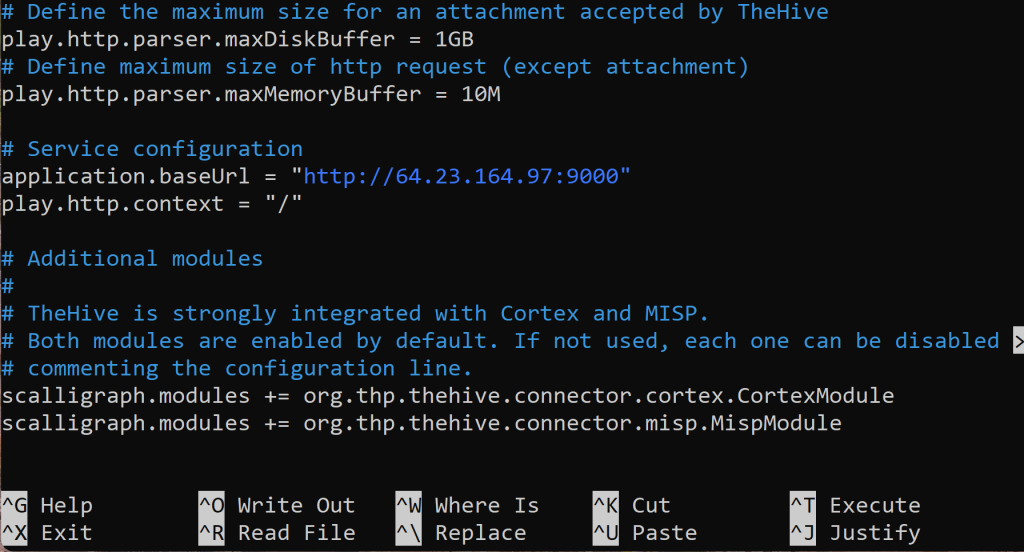
In ‘application.baseUrl = “http://localhost:9000” to ‘thehive’ public IP address as shown above.
Also, I see that the Cortex and MISP are enabled by default but, can be disabled. Cortex is their data enrichment and response capability. While, MISP is used for CTI (Cyber Threat Intelligence) platform.
Let’s go ahead and save the configuration file.
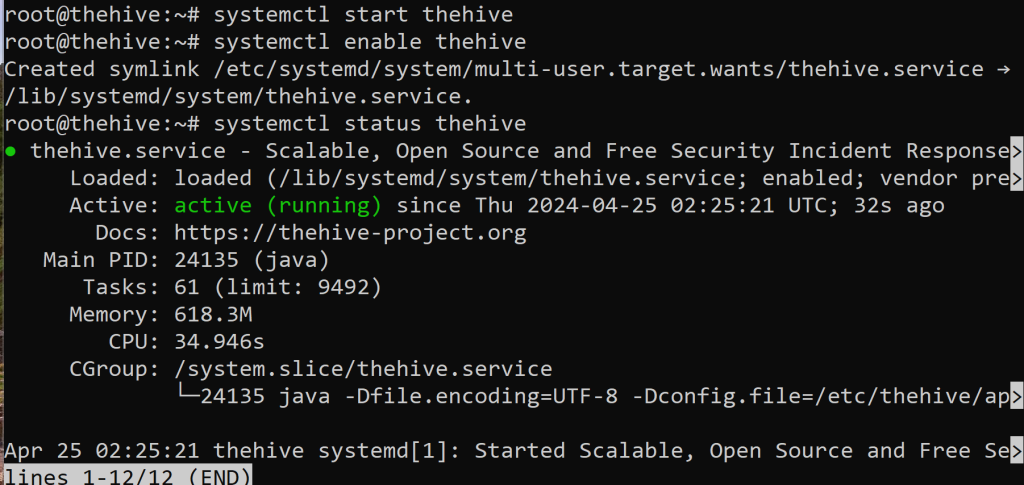
Start and enable the hive using the commands above. Then, verify if TheHive is actually running. It’s good habit to check the other services too.
My ElasticSearch service had stopped so, I restarted it up and took a minute or two to get back up and running. Thus the importance of checking every so often because in theory it enable us to run TheHive.
http://<Your Server IP>:9000
user: admin@thehive.local
password: secret
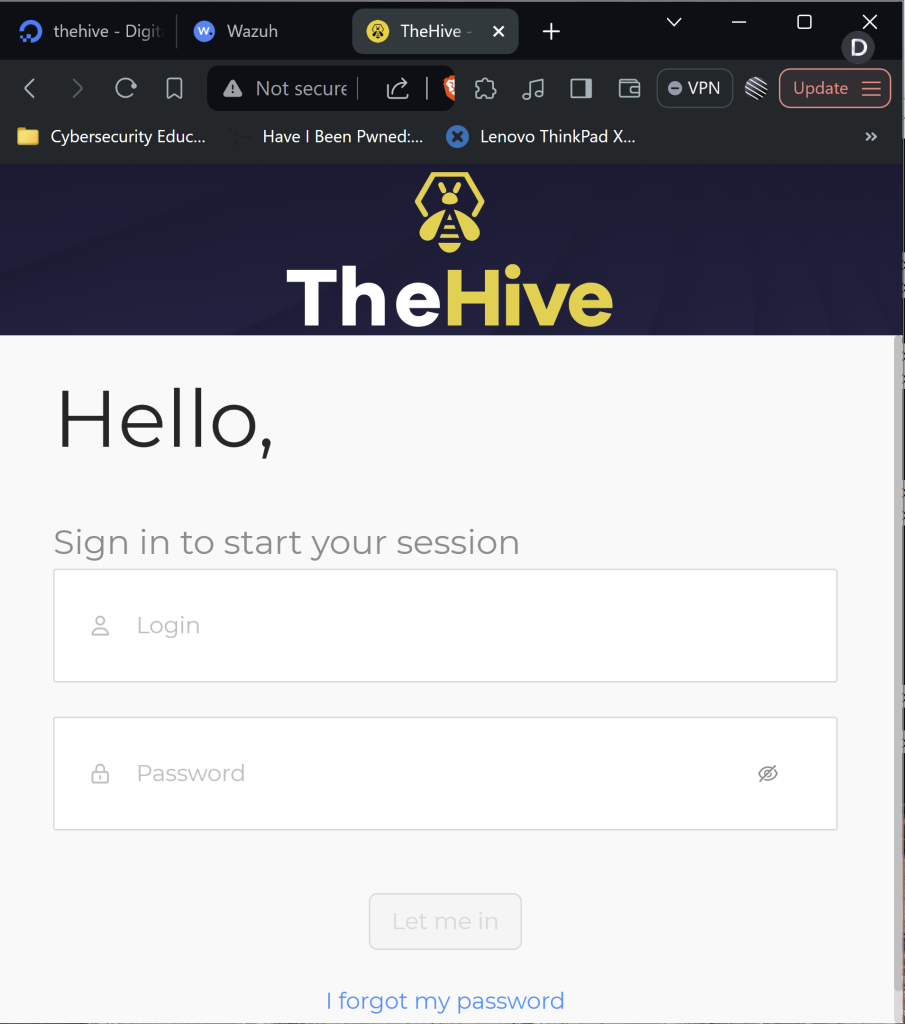
We have successfully setup the TheHive with the dashboard showing!!!
I was having issues logging via the default credentials.
I checked the status of elasticsearch and it was down. (failed)
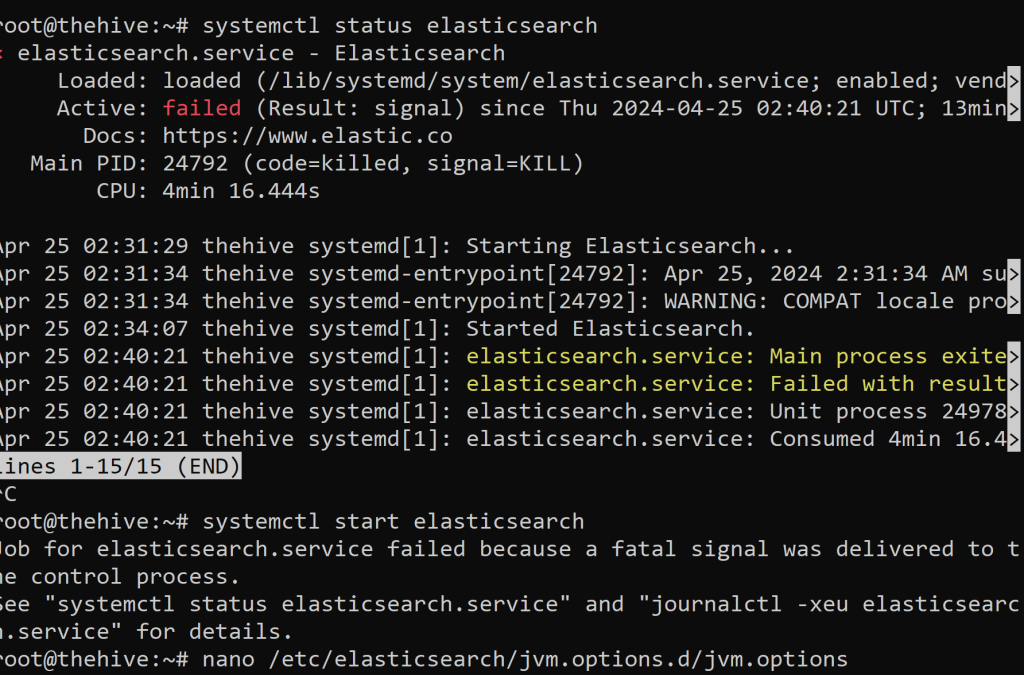
Upon trying to restart the Elasticsearch service. It returned a failed error. Instead, let’s nano into Elasticsearch directory and change the JavaScript performance from 4gb to 2gb to help with performance.
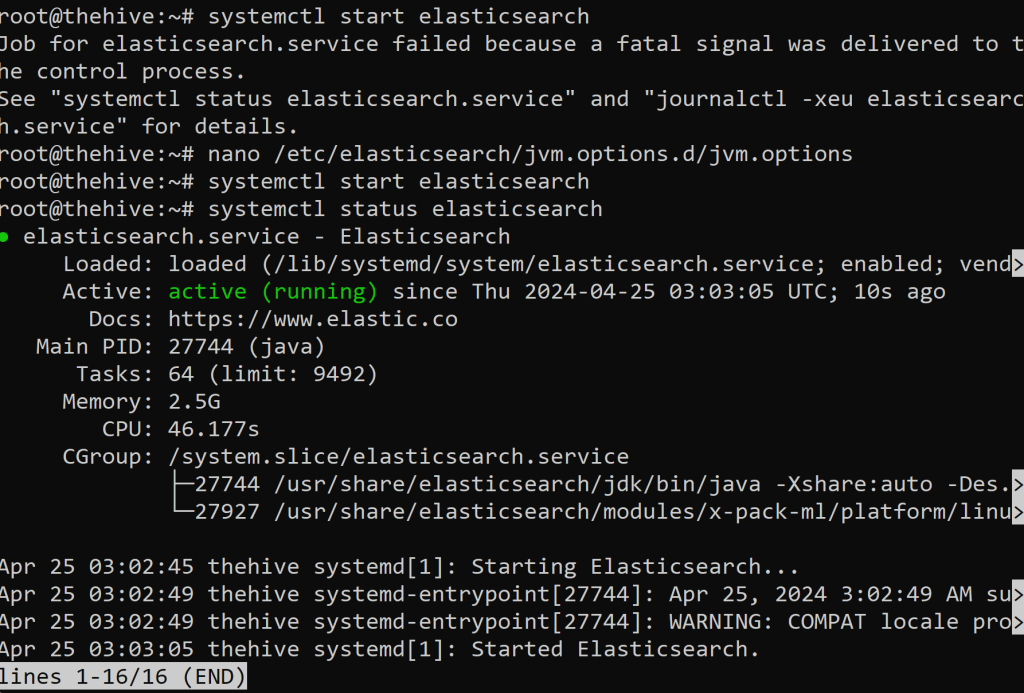
Upon rechecking we now have elasticsearch service running! We should be able to login using default credentials now.
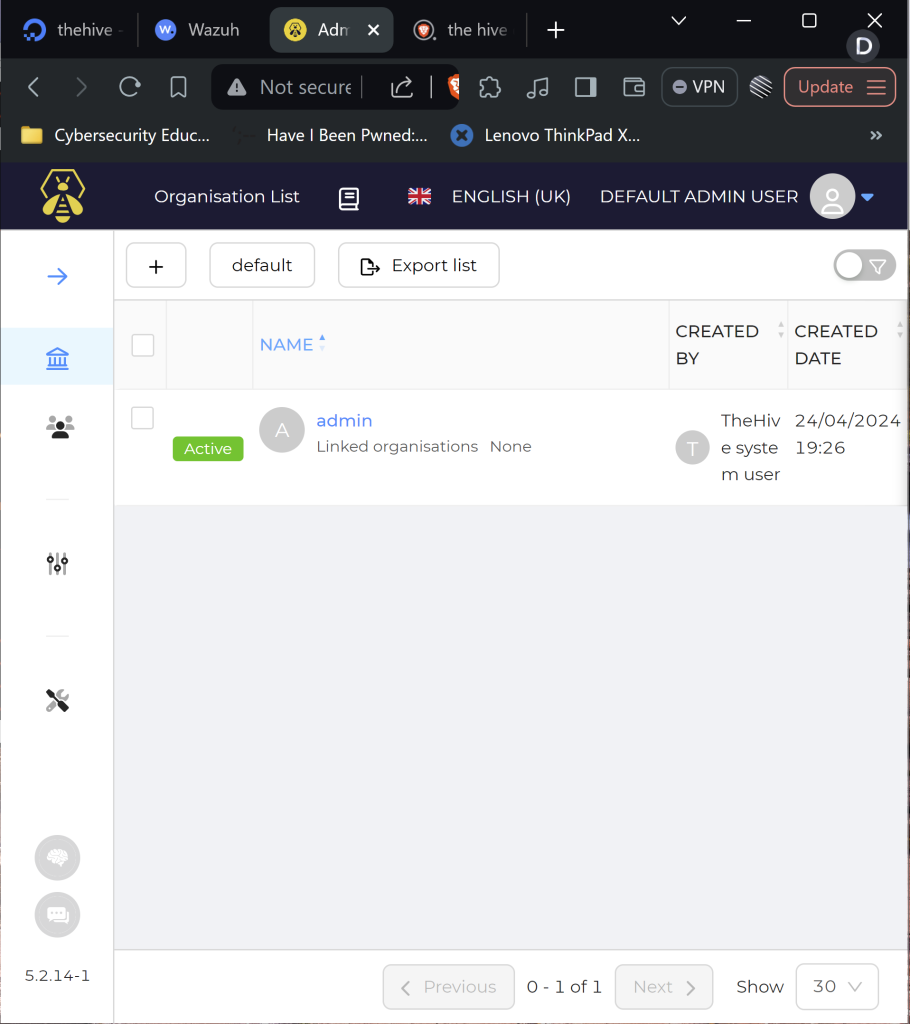
Sweet!! We are in! Now, that we have TheHive configured we will move onto configuring Wazuh server.
Let’s login using our credentials we had saved.
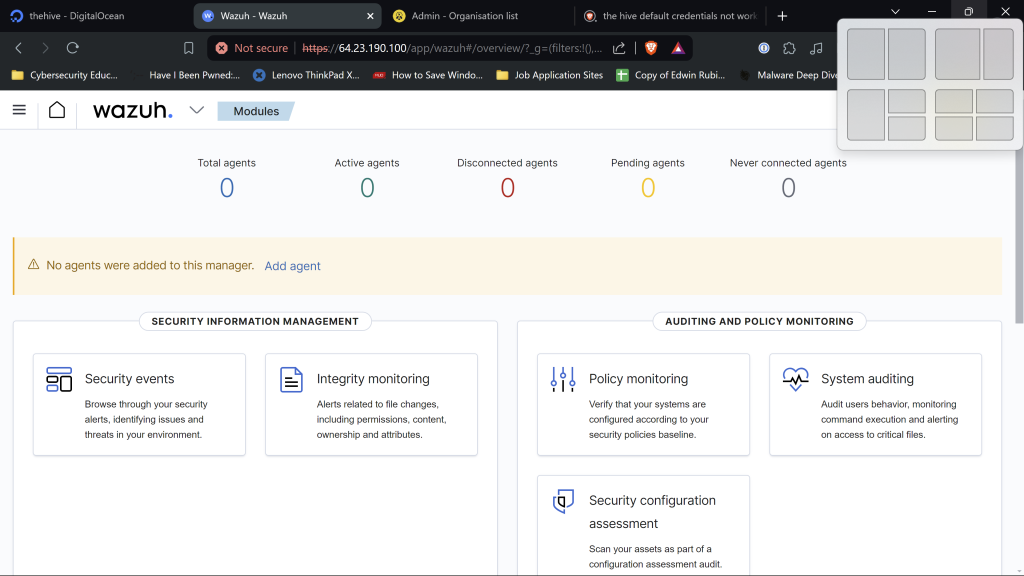
We are immediately met with no agents installed into our manager.
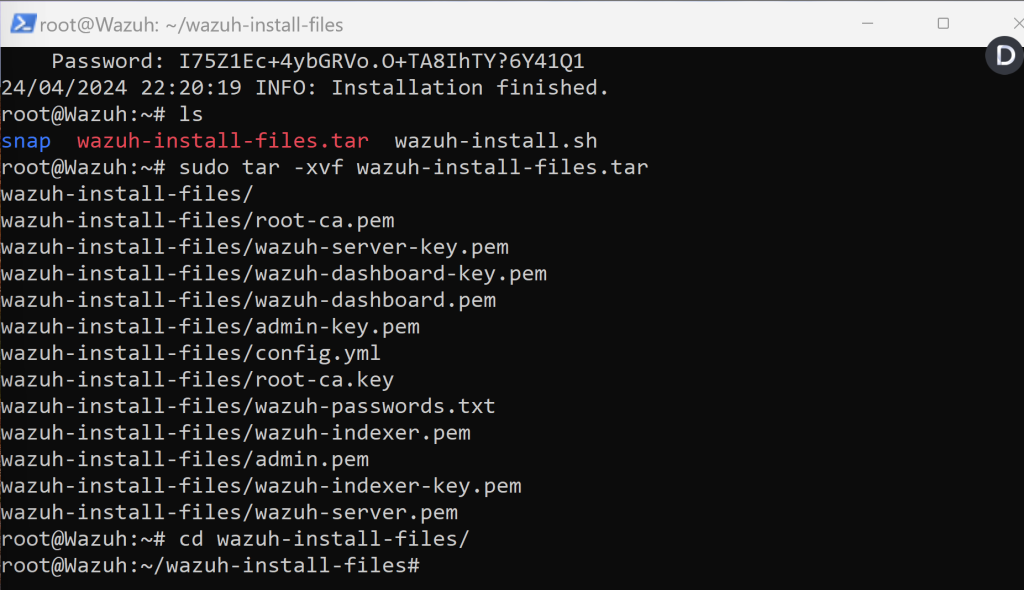
Let’s hop right back into Wazuh server terminal and run the ls command to check if the Wazuh install files exist. We then want to extract .tar Wazuh install file. Right afterwards want to change right into that directory.

Go right back into that directory and ls into it to see what we’ve got. We are interested in the “wazuh-passwords.txt” file. We shall concatenate into the file.
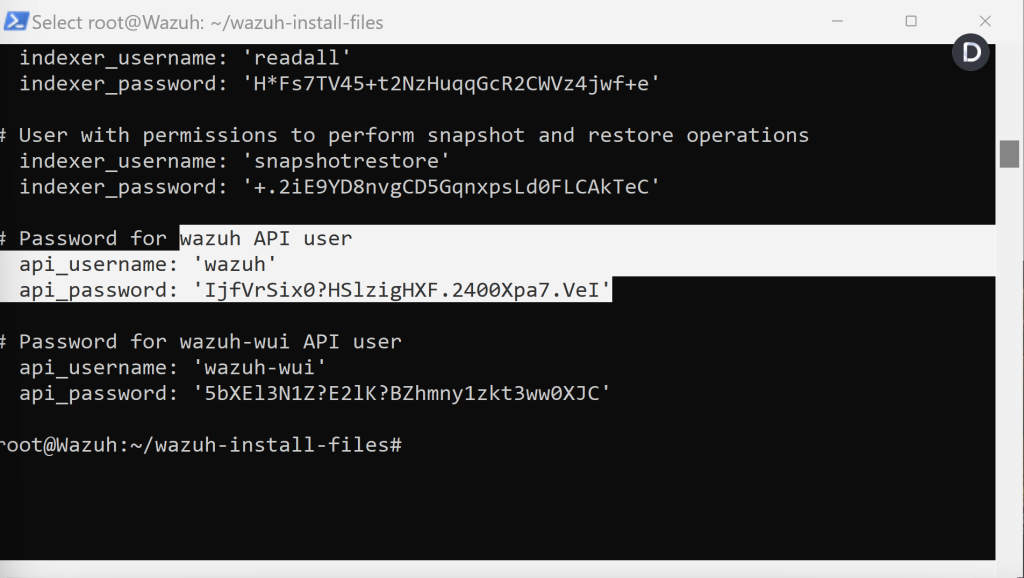
We are going to be using the Wazuh API user credentials later on in the lab.
Let’s get back into Wazuh and add the missing agent by clicking ‘Add agent’ button.
Scroll down and click on Windows.
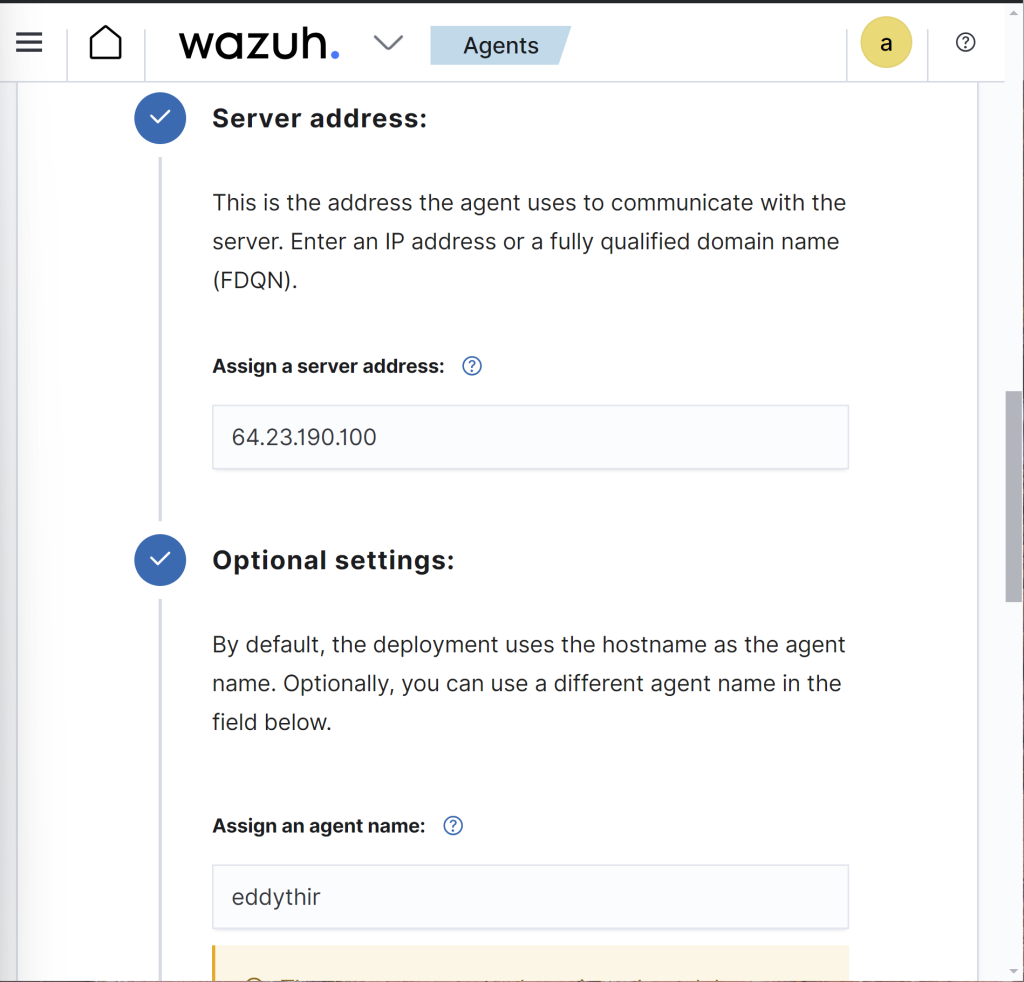
Scroll down further, and add in your Wazuh server droplet public IP. Also, set a agent name of your choosing.
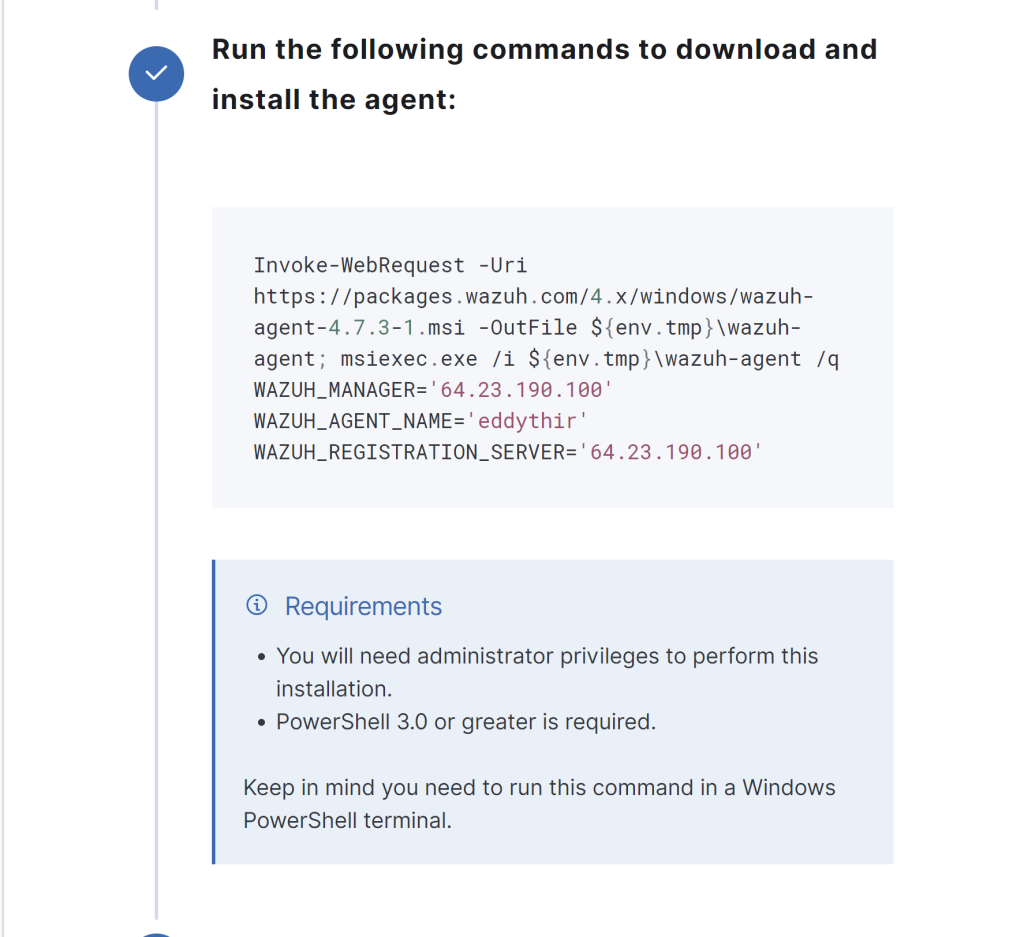
Copy and paste this command once your configurations are ready.
net start wazuhsvc
To begin starting the Wazuh service. Additionally, we can start the Service in the “Services” program.
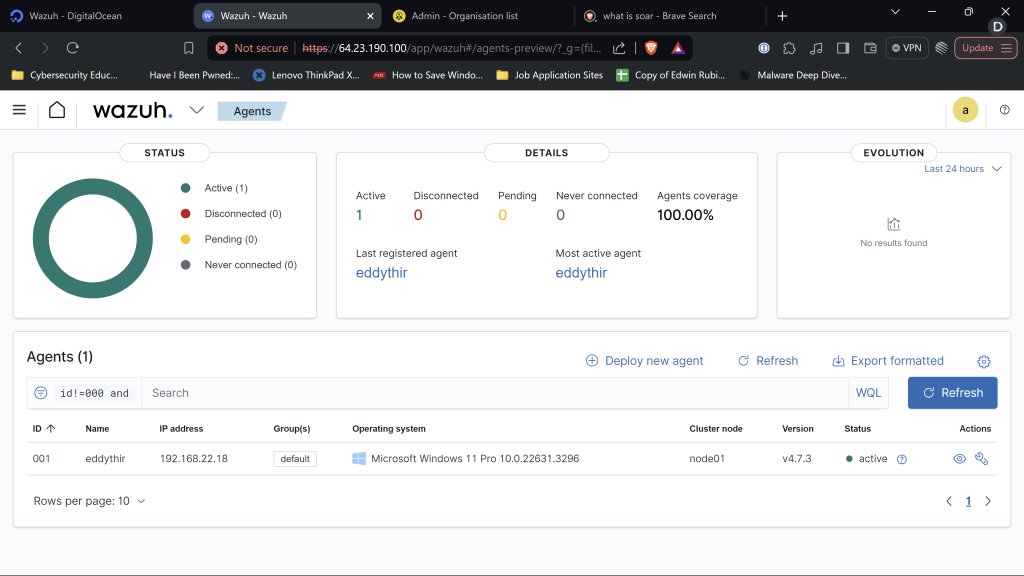
Back to Wazuh we should see that our Agent is connected. We just successfully configured our Wazuh server well done!!
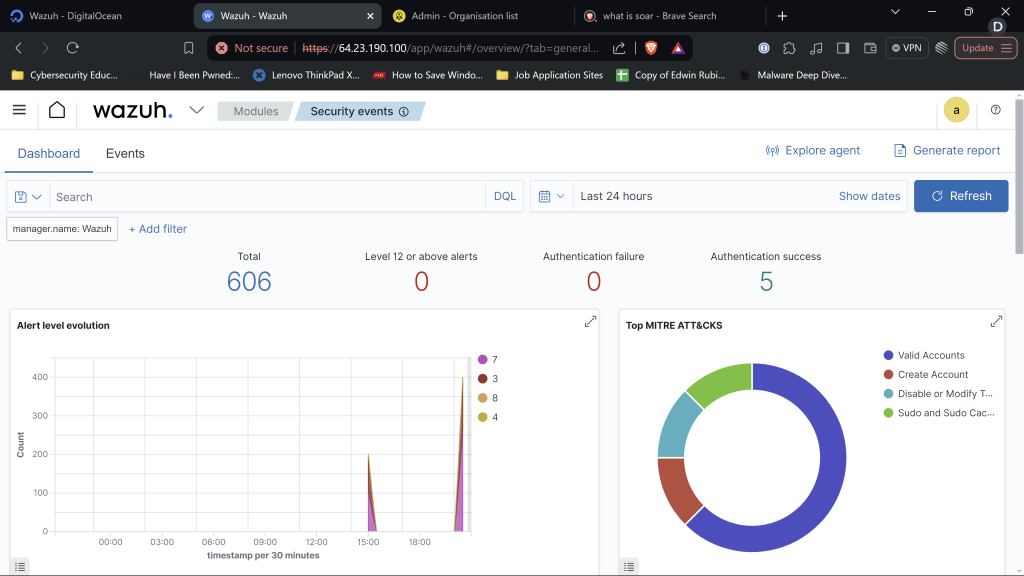
We can maneuver into Security Events and begin querying Security Events in Wazuh!!! We just configured Wazuh & TheHive and now working as expected. Our next goal is to create telemetry using Mimikatz in our Windows 10 machine. While also, creating an alert in relation to Mimikatz so it doesn’t go undetected next time around. Which, is what we will do next! >:) Remember, to be legendary! Cheers!! I’ll see you next time!!!


