I would like to give a huge shoutout to @MyDFIR for the idea of this project!
Objective: Our goal is to have our home lab setup configured correctly.
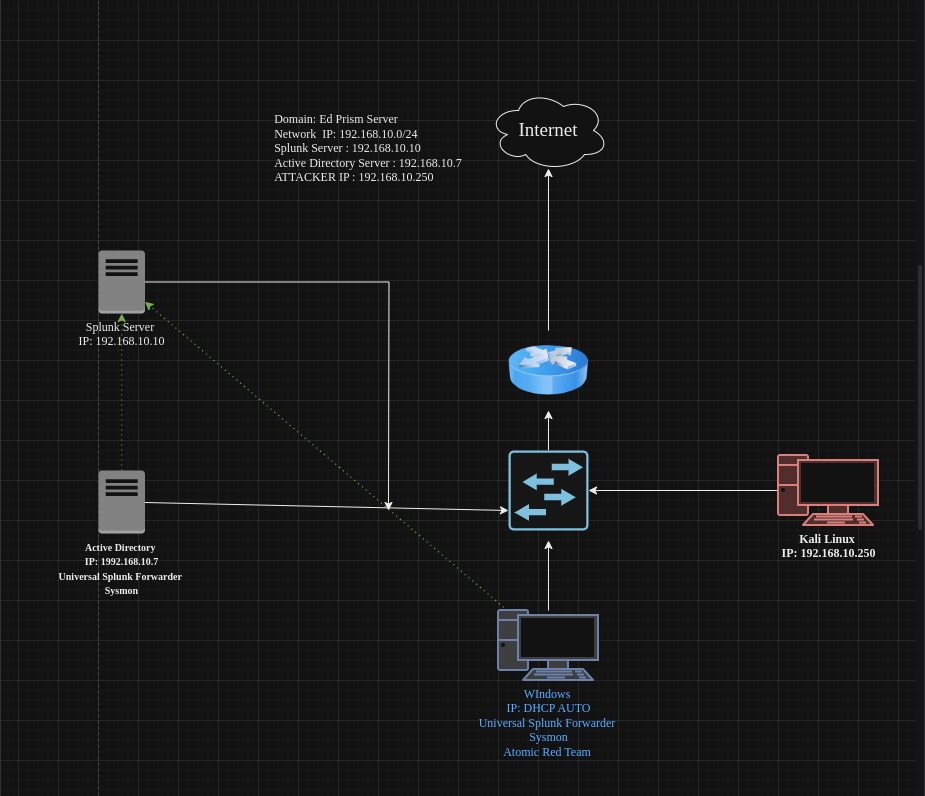
Ref: The lab diagram on title image on how we are going to setup our lab environment
First, we will install virtual box.
After, will start by downloading the VM .ISO files for:
- Windows Server 2022- 4gb Ram/ with 2 cores / 50gb
- Windows 10 Pro- 4gb ram/ with 1 core/50gb
- Ubuntu Desktop Server- 8gb Ram/ with 2 cores/100gb
- Kali Linux- 4gb Ram/with 1 core/25gb
We will begin to install them with these minimum requirements and have them set them up by default. We will be documenting our credentials in a text document for demo purposes. Once you finished setting up Ubuntu Desktop we shall begin setting up our Splunk Server.
Configuring our Splunk Sever

Let’s run this command to update and upgrade our repositories.
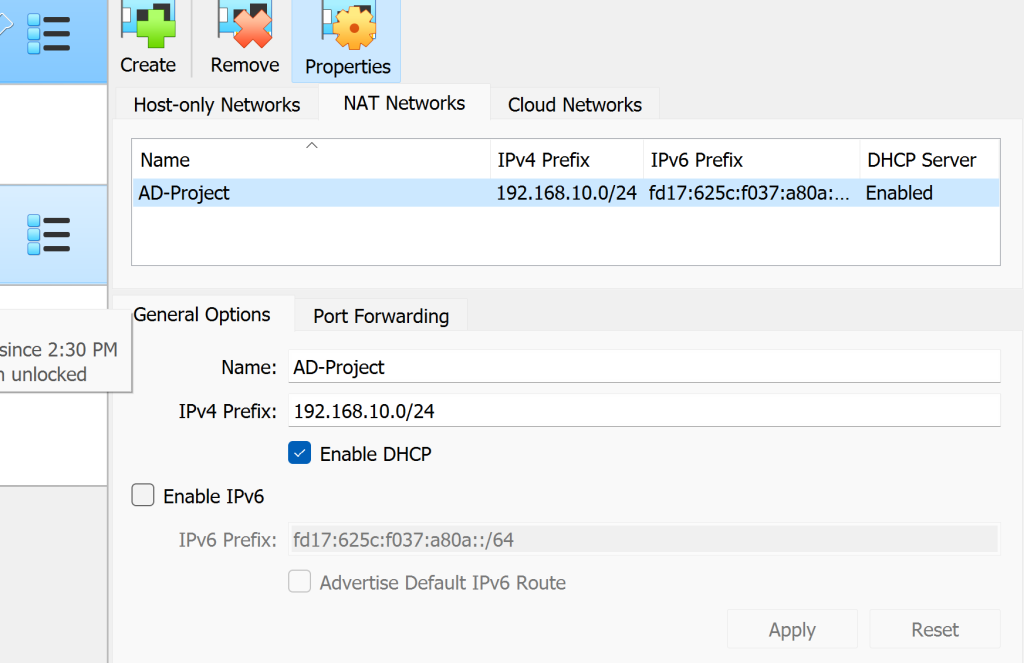
Let’s create a NAT network for all of our VMs to be interconnected with one another. Apply the NAT network we just created to all VMs.

Our IP isn’t the same as our lab diagram. We shall proceed by creating a static IP address of 192.168.10.10/24. Lets run the following command to begin editing our machine’s IP using nano and editing the .YAML file
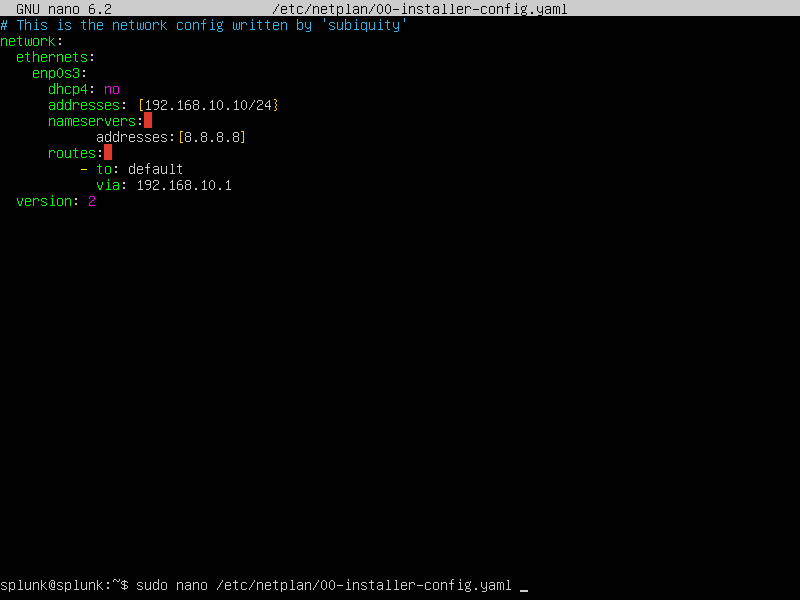
Lovely! With these edits and indentations we have set the static IP. We than proceed to apply the changes using the following command
sudo netplan apply
It will be followed with some warnings but that’s fine. Next,

We just checked that the Ip address truly changed and set itself to 192.168.10.10/24 Success!!!
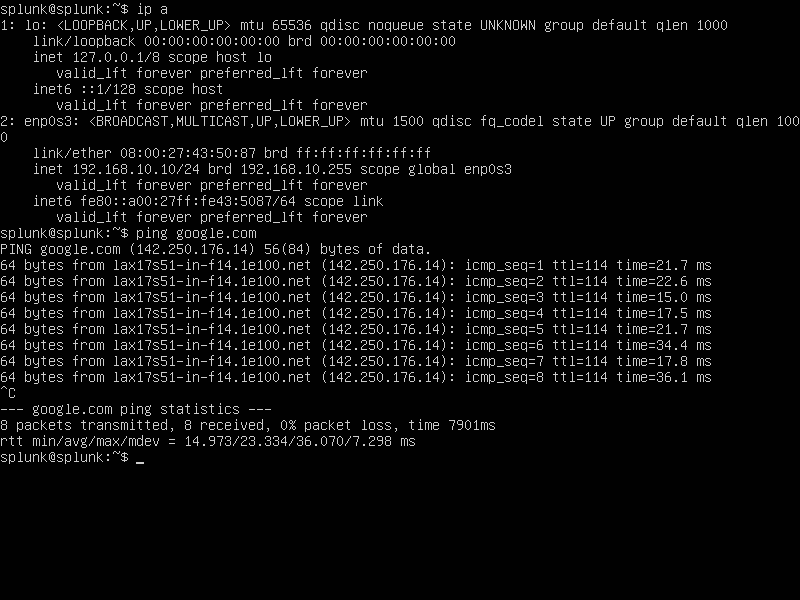
We want to also ensure connectivity so let’s attempt to
ping google.com
Now we must go on over to our preferred web browser and go to Splunk sign up with an account because we are going to install Splunk Enterprise onto our Splunk Server. Make sure it’s the .deb version of it as shown.
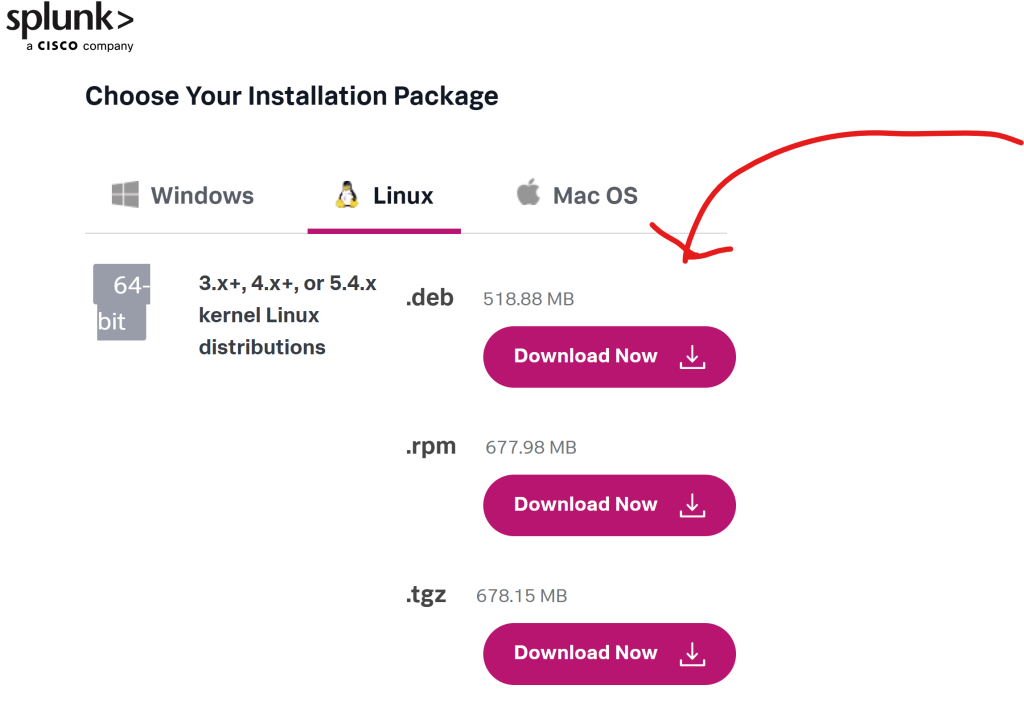
We are going to go back to our CLI and add our guest add ons for virtual box.

Say ‘Yes’ to installing it. After it’s finished installing click enter.
Next, we are going to proceed into installing Splunk Enterprise onto our Splunk Server by adding a share folder onto our VM.
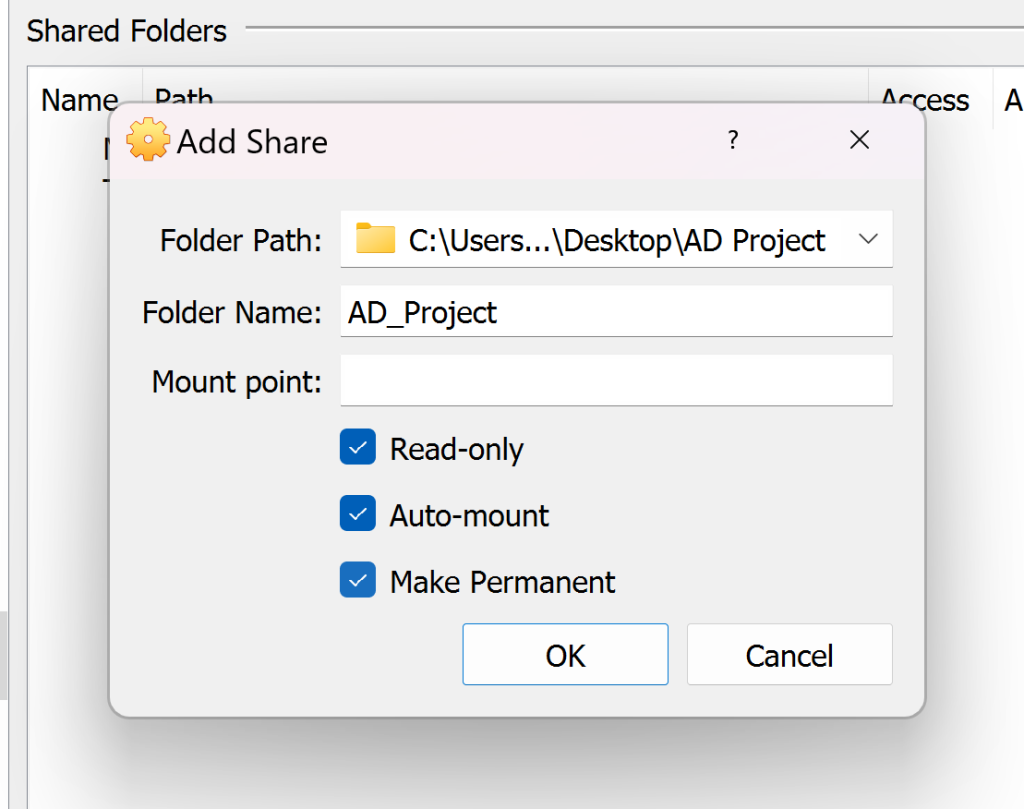
I created a folder where I kept the .deb file of Splunk Enterprise and all files related to the project called ‘AD Project’. Next, let’s reboot our machine by,
sudo reboot
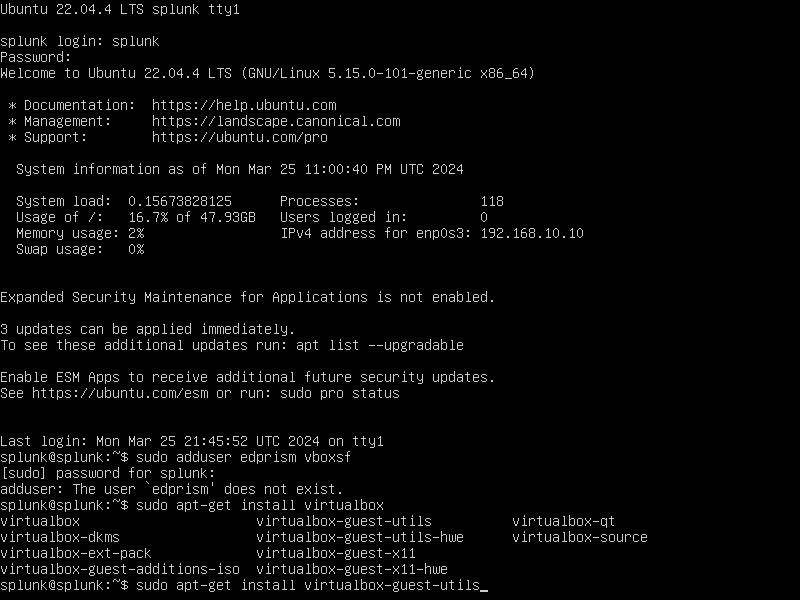
As we attempted to add a user to the vboxuser group. We were hit with an error. We were missing an additional feature
sudo apt-get install virtualbox-guest-utils
If we attempt it again we shall be able to add a user ‘splunk’ to the vboxuser group.
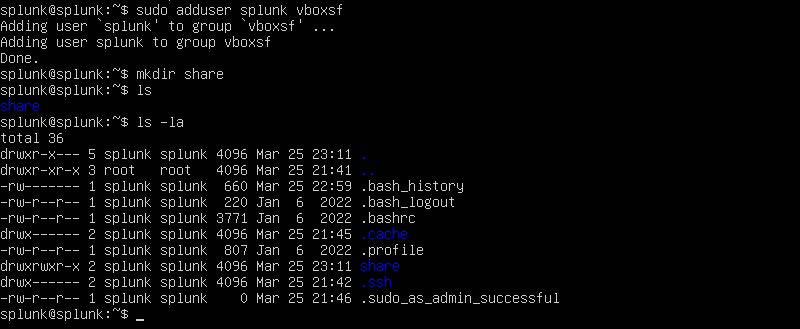
We will want to create a directory called ‘share’.
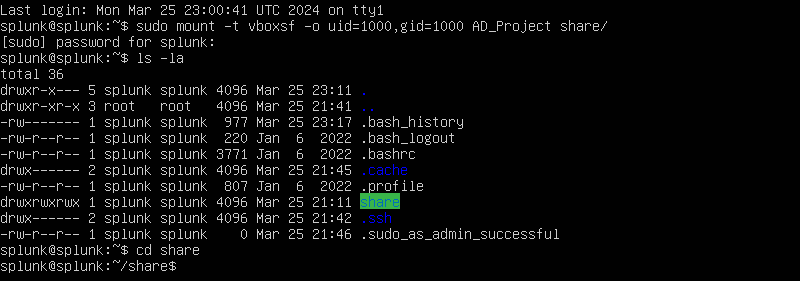
We will want to run the following command as shown by adding our ‘AD_Project’ folder in our host system onto the share folder that we just created. We will follow up with that by changing directory into our newly created share folder. Next, let’s run the following command:
sudo dpkg -i splunk-9.2.0.1-d8ae995bf219-linux-2.6-amd64.deb
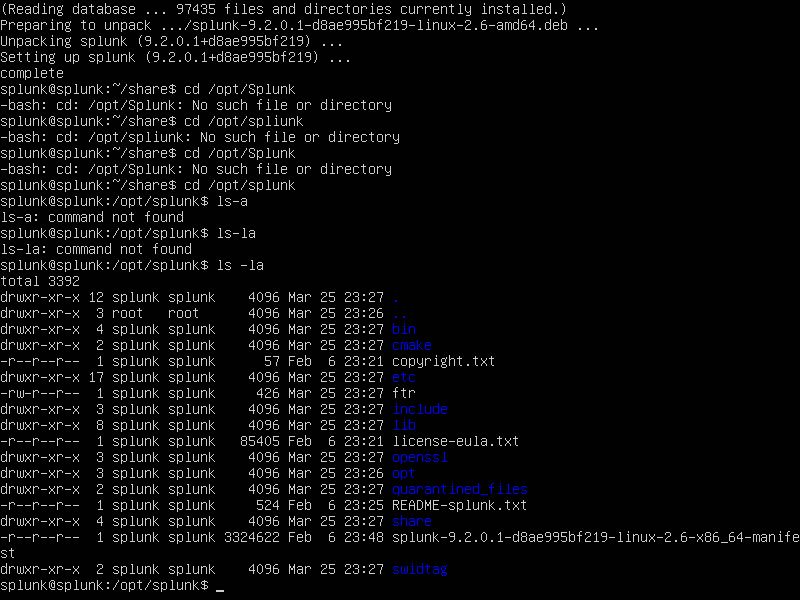
Now, we opted out into the cd/opt/splunk directory. We proceed to look into the directory and see the permissions are given to the user splunk. We will now want to act as the user splunk by,
sudo -u splunk bash
We will want to change into the bin directory as that folder contains all the binaries that Splunk can use.
./splunk start
We will now want to launch our Splunk server! We will want to then put in our credentials and document them into our text file for future reference.
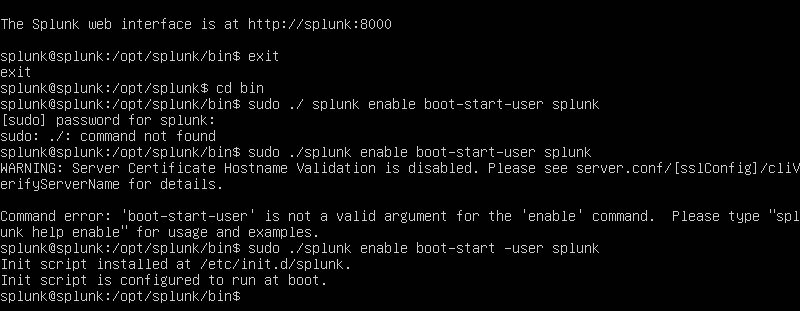
Let’s exit out of being the user ‘splunk’. Change into the bin directory again. We then shall run the following command shown above to make sure every time we boot up Ubuntu server it automatically boots up the Splunk server.
Configuring Target-PC w/Sysmon & Splunk Universal Forwarder
We will go ahead by starting off by renaming our PC to ‘target-PC’.
Search ‘PC’ in search bar>properties>rename this PC>restart PC
Expectedly should have changed to our desired name target-PC.
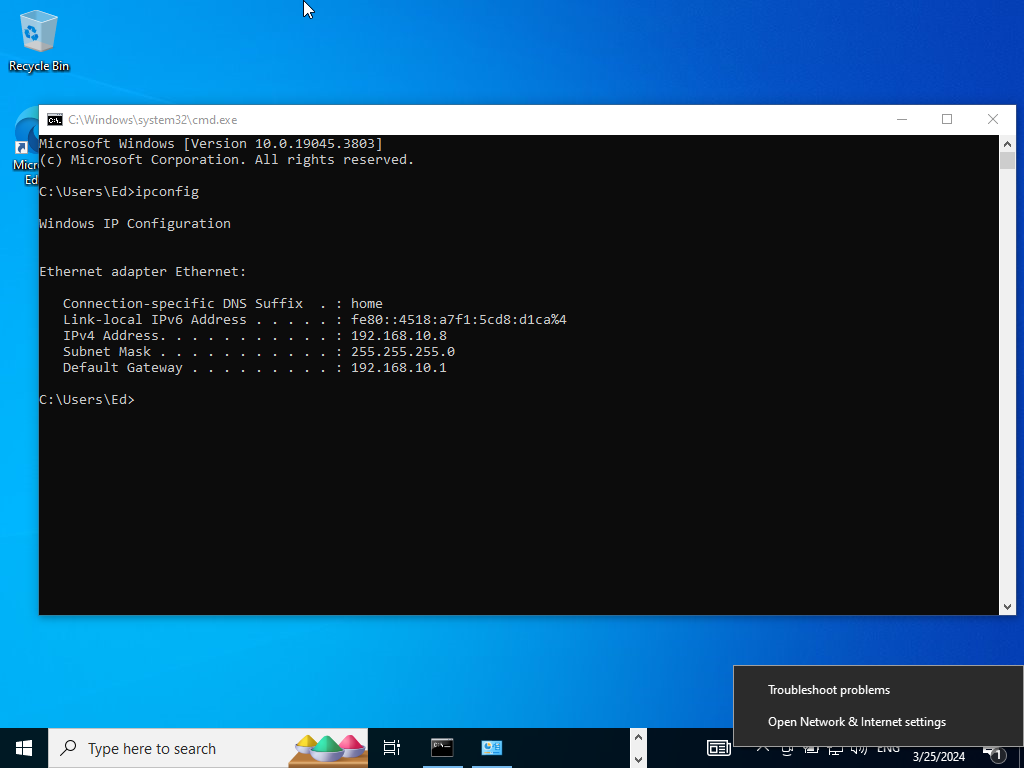
We see our current IP is 192.168.10.8 we want to change it to what our lab diagram mentions.
Open Network & Internet Settings>Change Adapter Options>Right click on properties>double click on ipv4
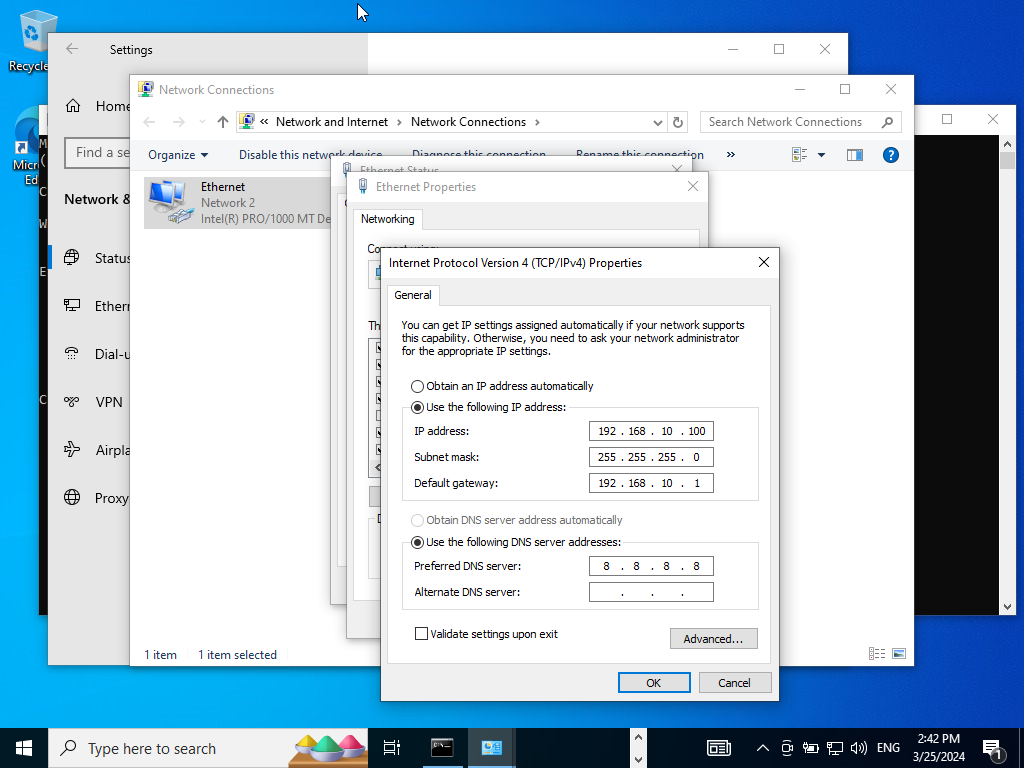
Change the following IP address as shown above. We have /24 subnet with the DNS server being pointed towards Google’s.
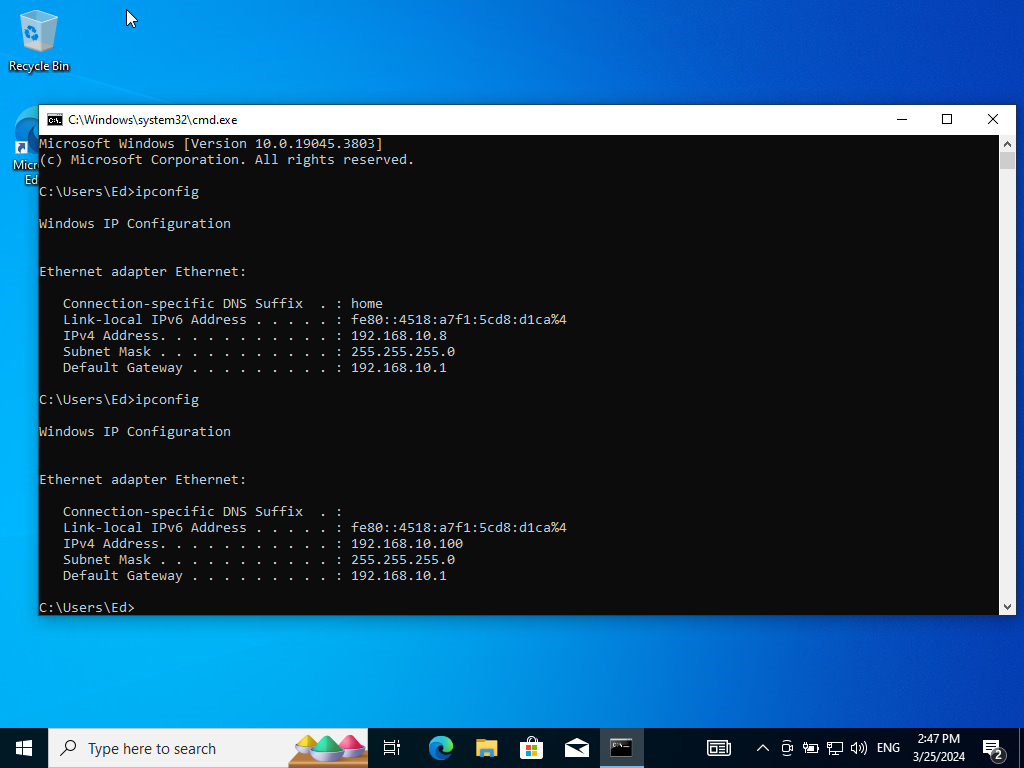
Go back to the command prompt and look at the IP again. Success!
Let’s go onto our browser and start a private window and let’s pull up our Splunk server.
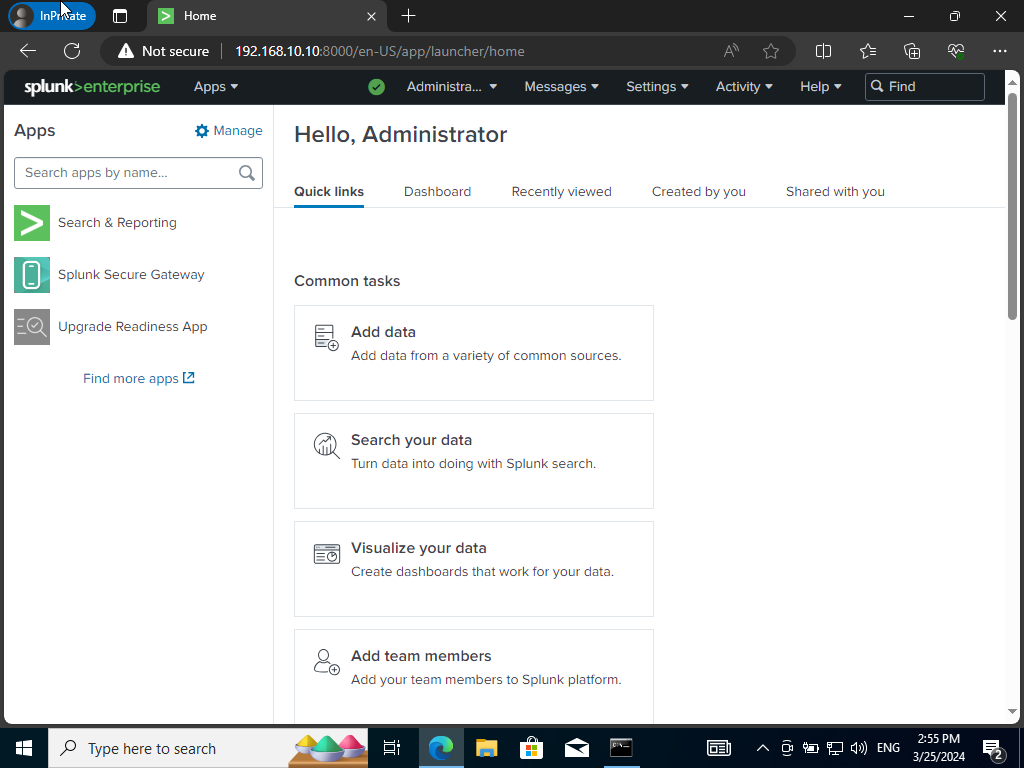
Now we will head over to splunk.com to download & install Splunk Universal Forwarder.
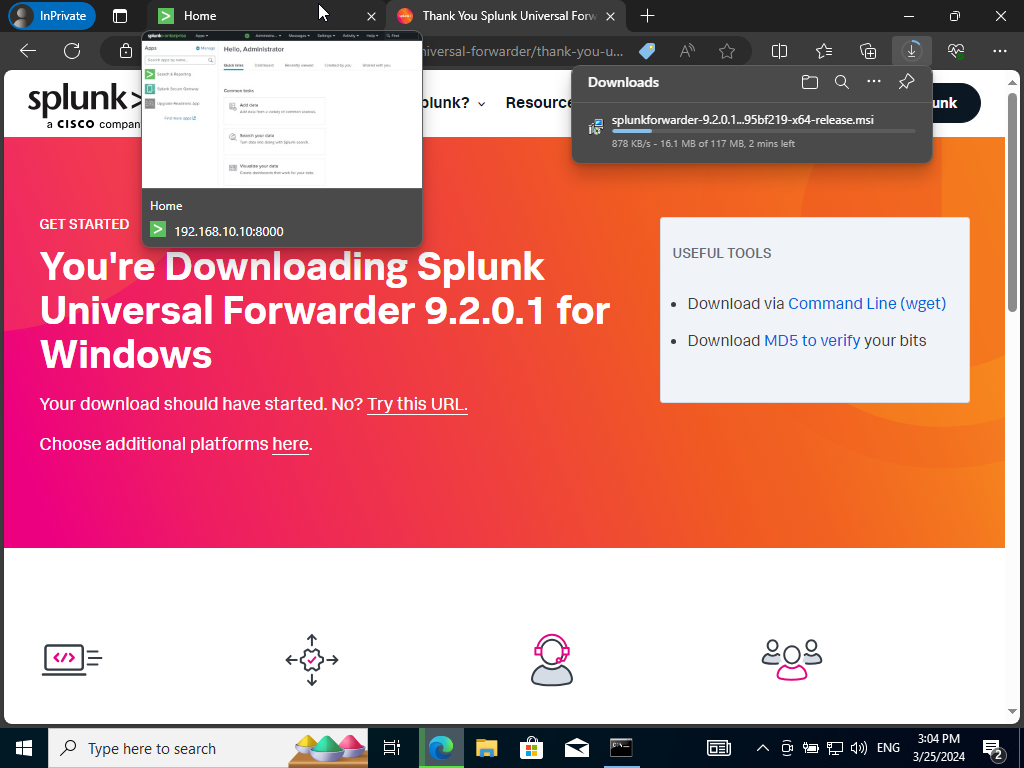
Once it finishes downloading, we will want to open the file and check the box to agree to terms and click next.
We then next create our credentials using the default username ‘admin’ & by checking the random password box and click next.
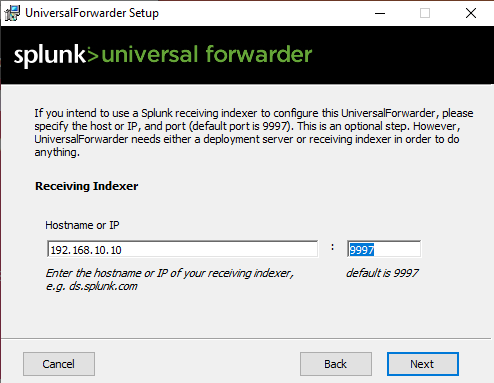
Let’s deploy our receiving indexer with the following IP and the default port number 9997. Afterwards click install and wait for it to install.
We will then proceed to downloading Sysmon. Also searching for this Github repo. Save the .xml file on the VM.
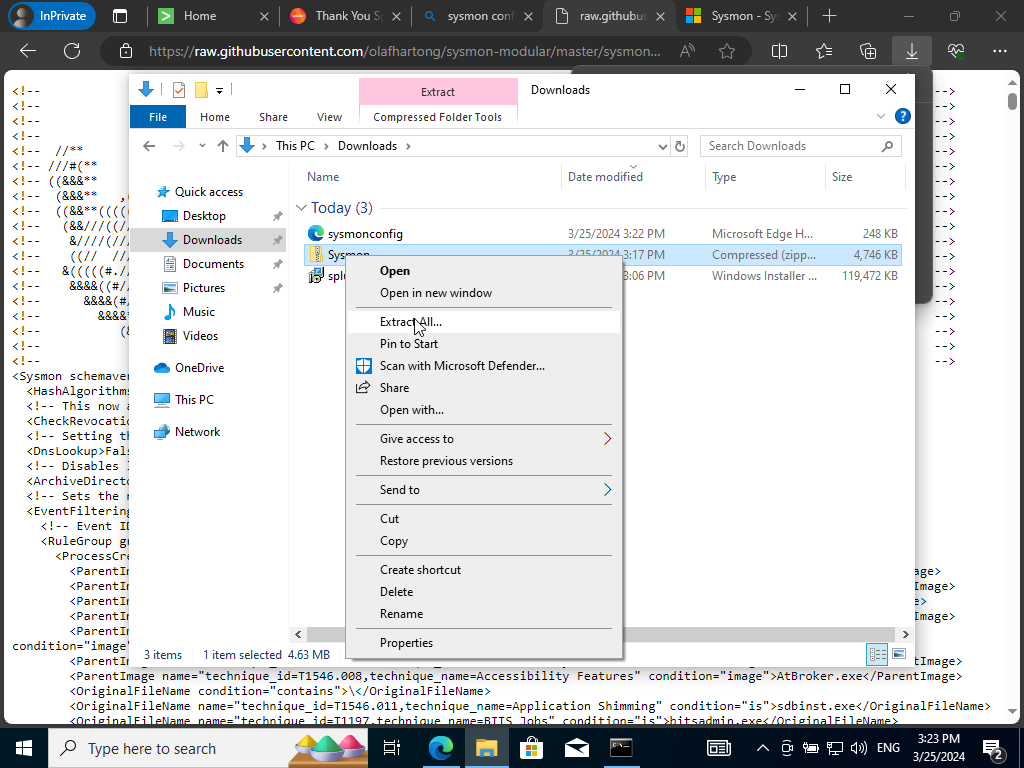
Next, we will want to extract the whole file onto our downloads directory.
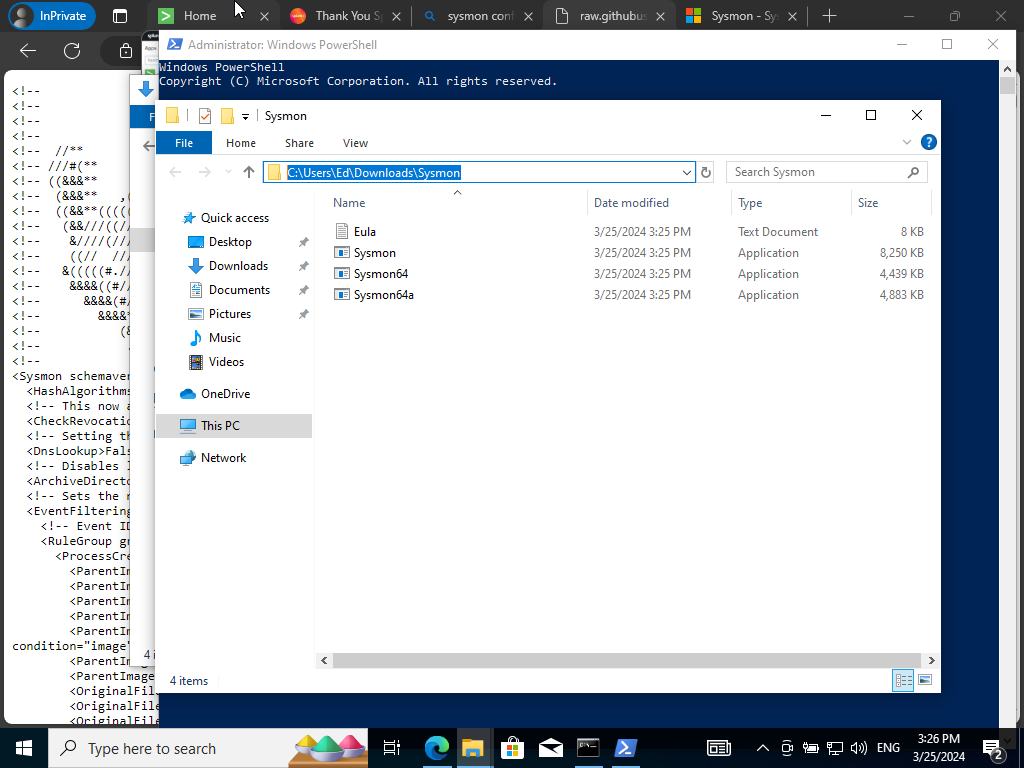
We will want to copy the path of the extracted Sysmon file. This will bring us to our next step by opening up PowerShell by running it as an admin.
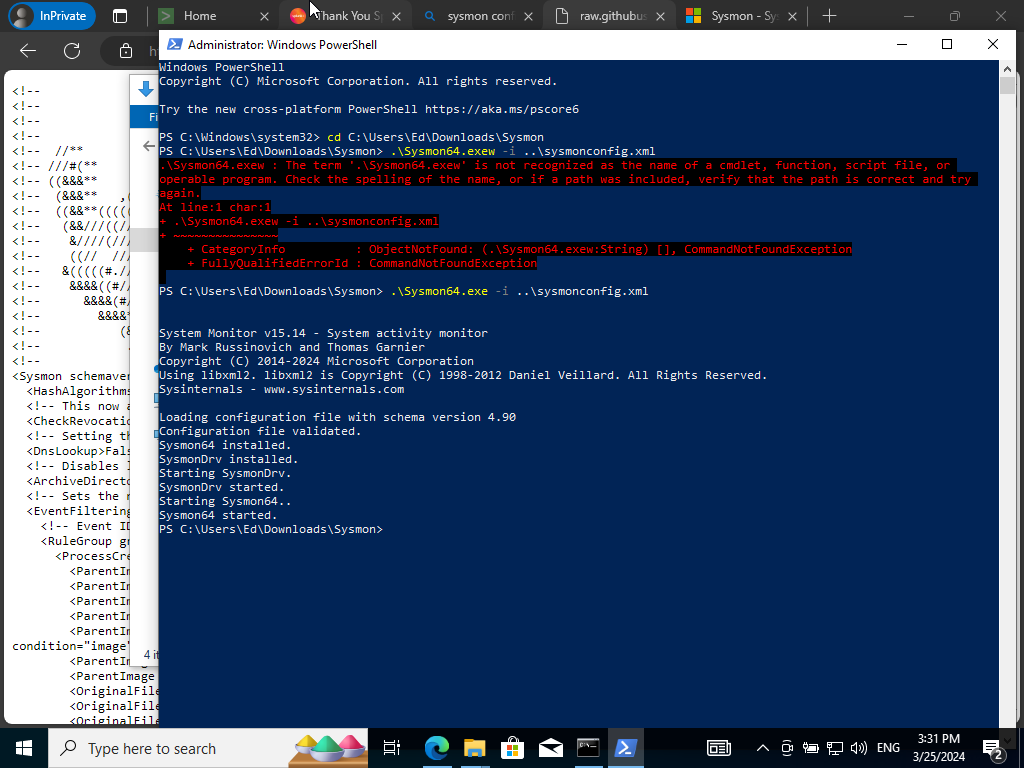
We will used the path we previously copied that leads to Sysmon files. Use the following command above to launch Sysmon.
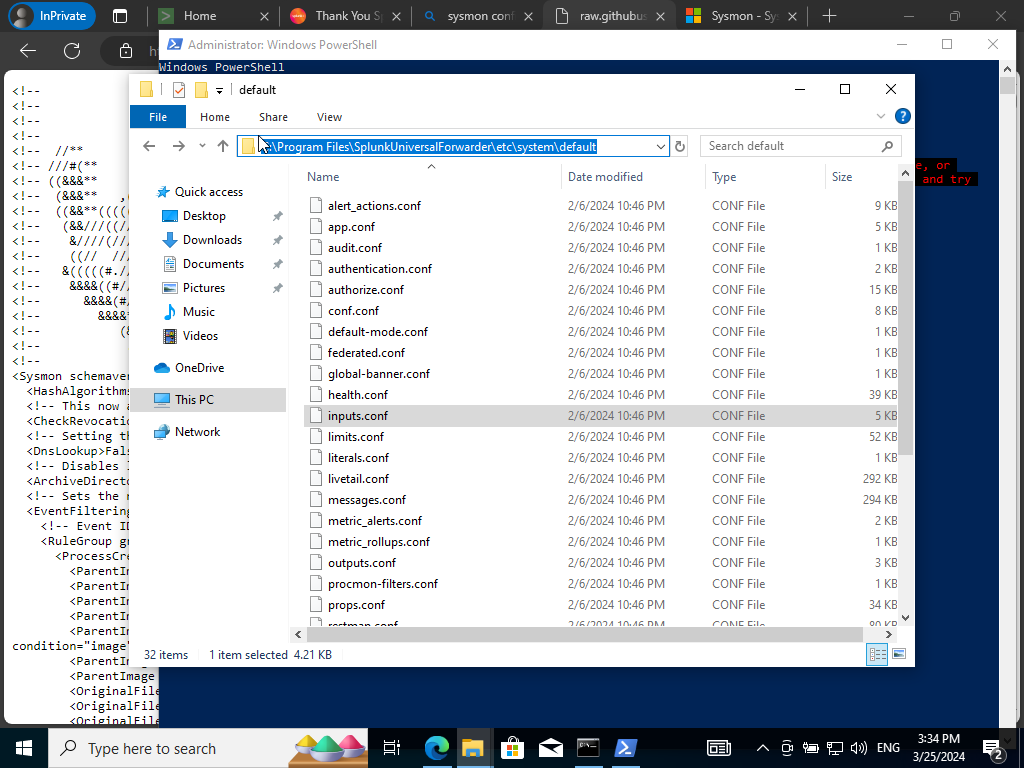
Next, follow the following path above to locate the ‘inputs.conf’ directory to then proceed with creating a copy in the local directory instead. Our default directory is just a backup we shouldn’t mess with.
Search up notepad in the search bar and run it as an administrator. We will copy and paste the contents of inputs.conf file into a .txt file.
We will be sending over the Windows Event Logs pertaining Application, Security, System, and Sysmon operations over to our Splunk Server.
Next, we will save our notepad .txt file over to our PC via the same path from earlier as shown below.
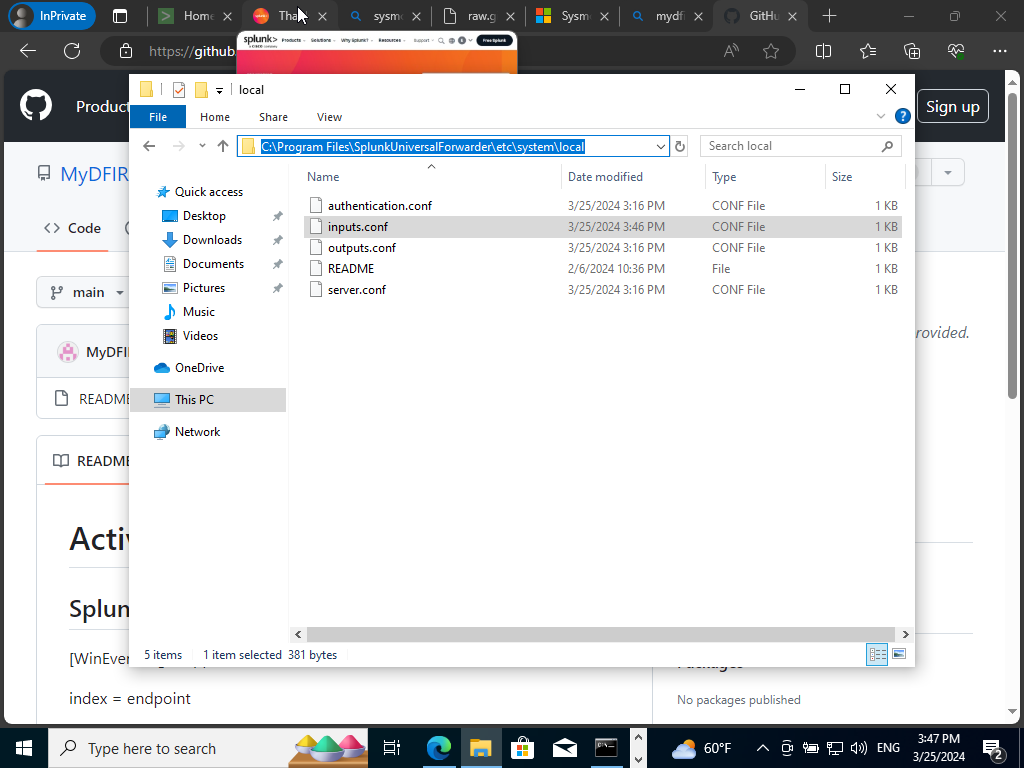
Rename the file to inputs.conf and change the file type to all types and save. NOTE: Anytime we update our inputs.conf file we must restart Splunk’s Universal Forwarder service.
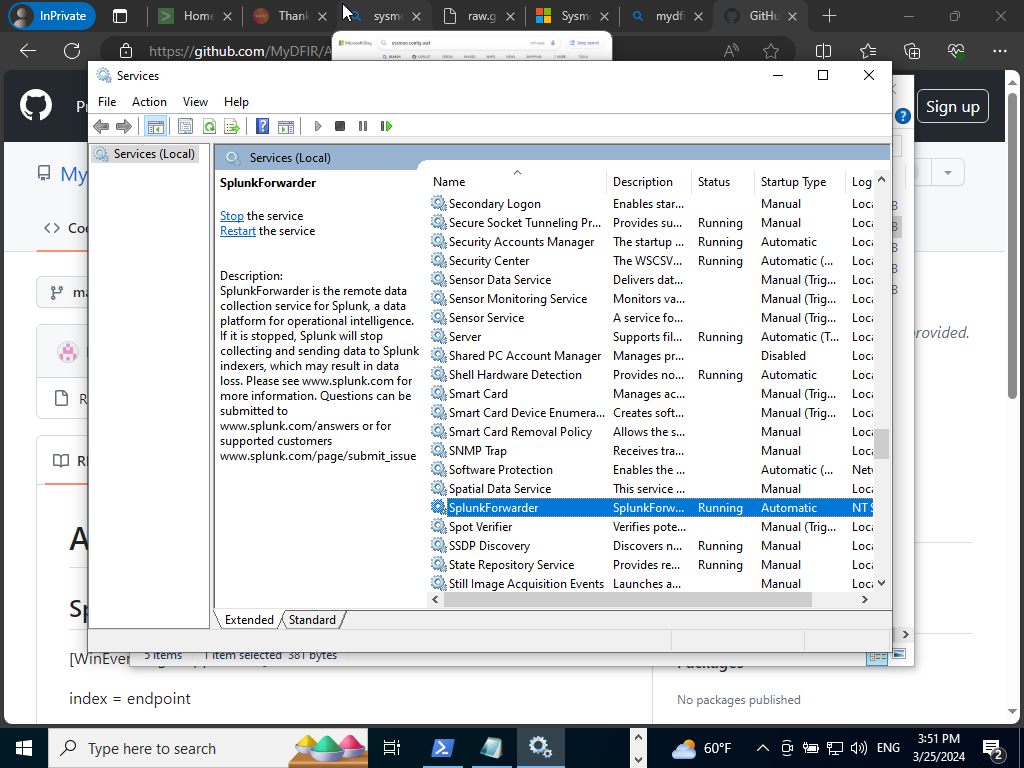
Search in search bar “Services”>Run as admin>SplunkFowarder>Double Click It> Log On>Click Local System Account>Apply>OK>Restart Service
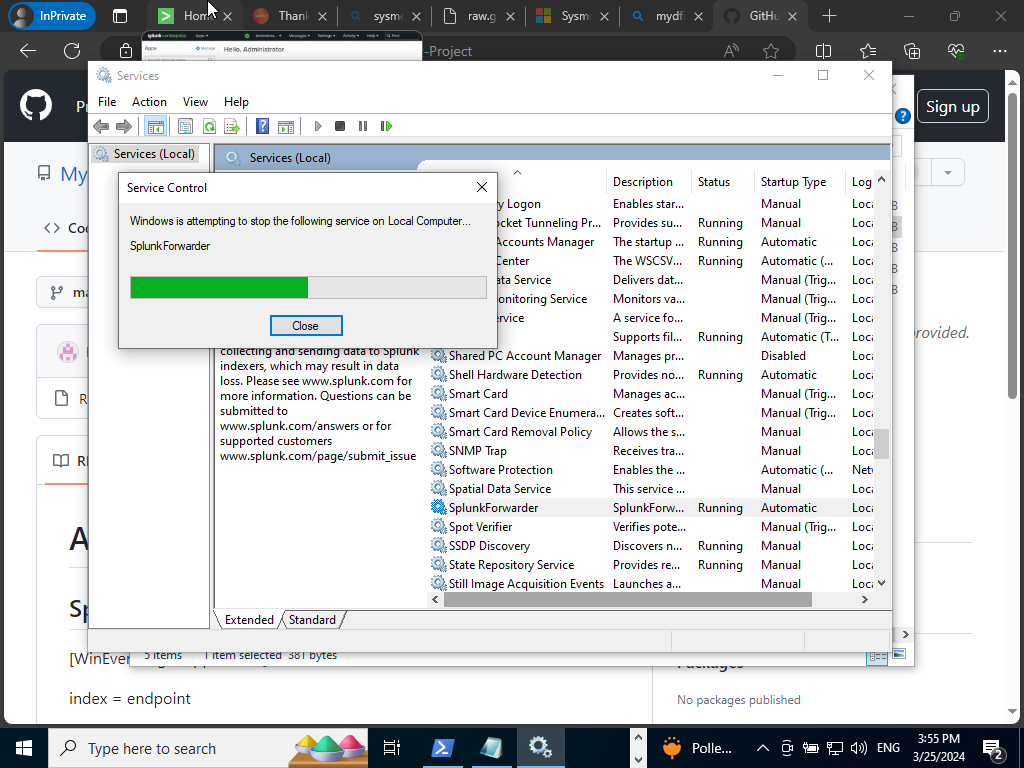
We got a error pop up but that’s okay. Just start the service again.
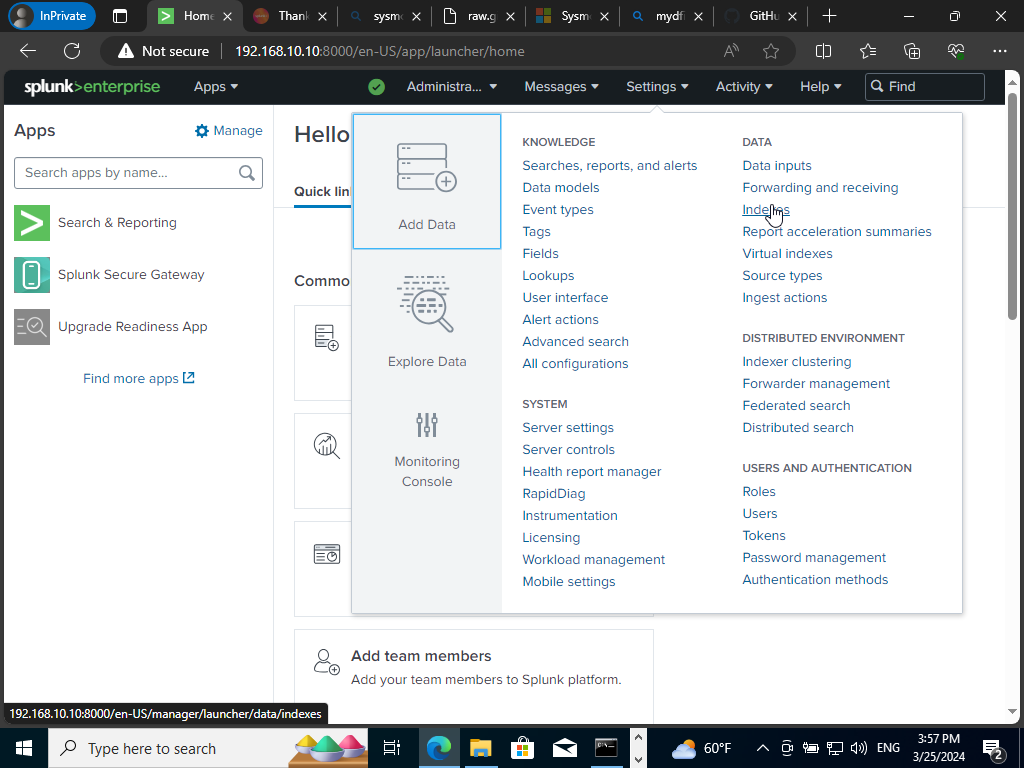
We will want to head over to our Splunk instance again and do the last configurations to our Splunk server by hovering over to settings>Indexes.
We will be shown all of the indexes that Splunk has to offer. Scroll to the top right corner and click on “New Index”.
Name our new index “Endpoint” and click ‘Save’.
Next, we need to enable our Splunk server to receive the data.
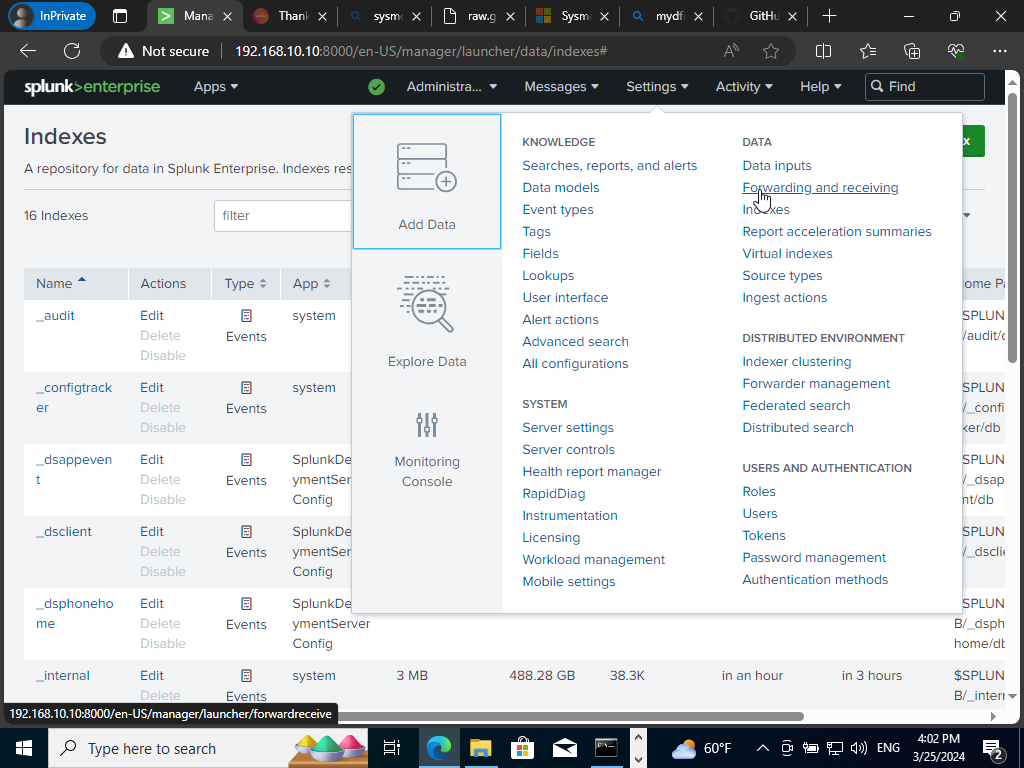
Click on Settings>Forwarding and receiving
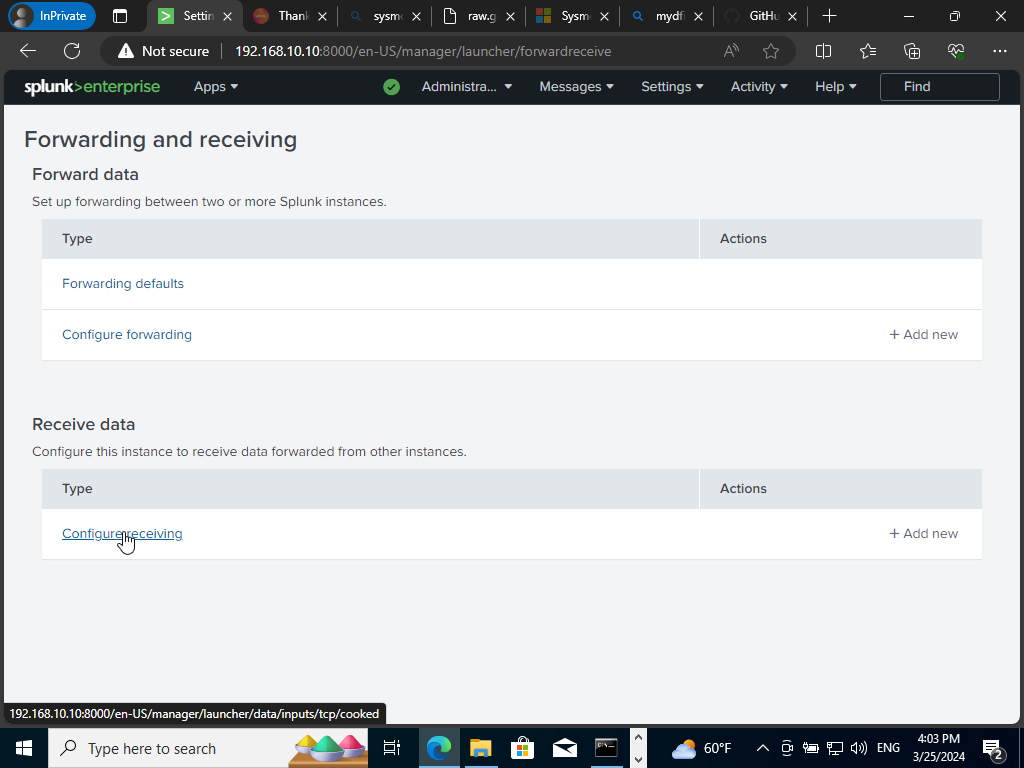
Click on configure receiving & on the top right “New Receiving Port”. Next, the default port will be 9997 like earlier when setting up our forwarder.
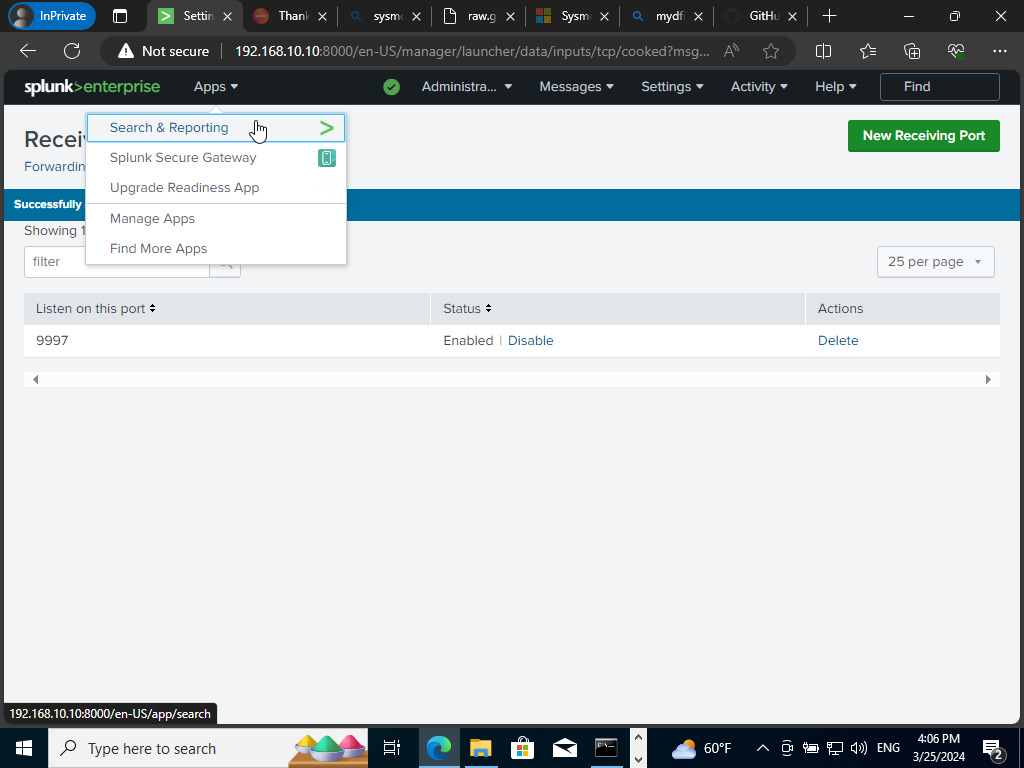
After clicking Search & Reporting. We will want to search ‘index=”endpoint”. We should be getting thousands of events for that filter.
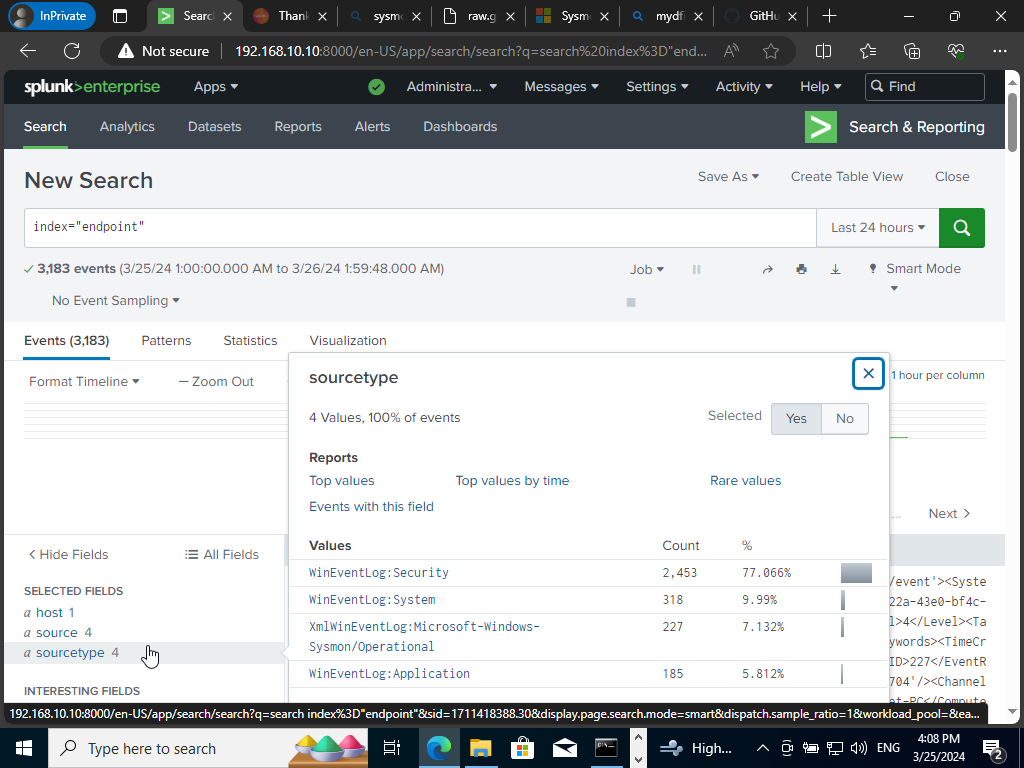
We have successfully configured Splunk. Remember the inputs.conf file from earlier which had the four windows event log types we wanted to ingest well here they are!
Configure Active Directory Server w/Splunk Universal Forwarder & Sysmon
First, we will want to rename our Active Directory Server PC to ‘ADDCC01’.
Search bar search “PC”>Click on Properties>Rename this PC>’ADDCC01′ We shall proceed to restart the PC to apply the changes now we may proceed to installing Splunk & Sysmon onto our AD Server.
It will be the same process like our Target machine the only difference is that the Server Static IP will be different. We will want to change our static IP to 192.168.10.7
Our current IP is 192.168.10.9
Again Open Network & Internet Settings>Change Adapter Options>Right click on properties>double click on ipv4
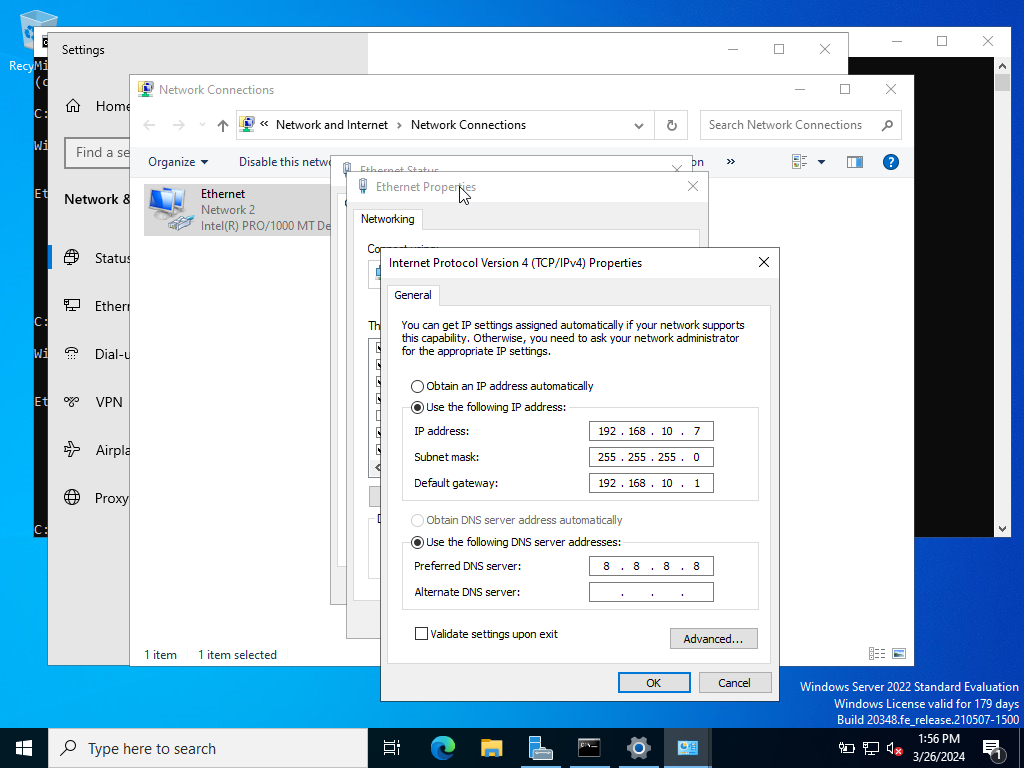
Now we have our static IP set. We can go back to our command prompt and check to see the applied changes.
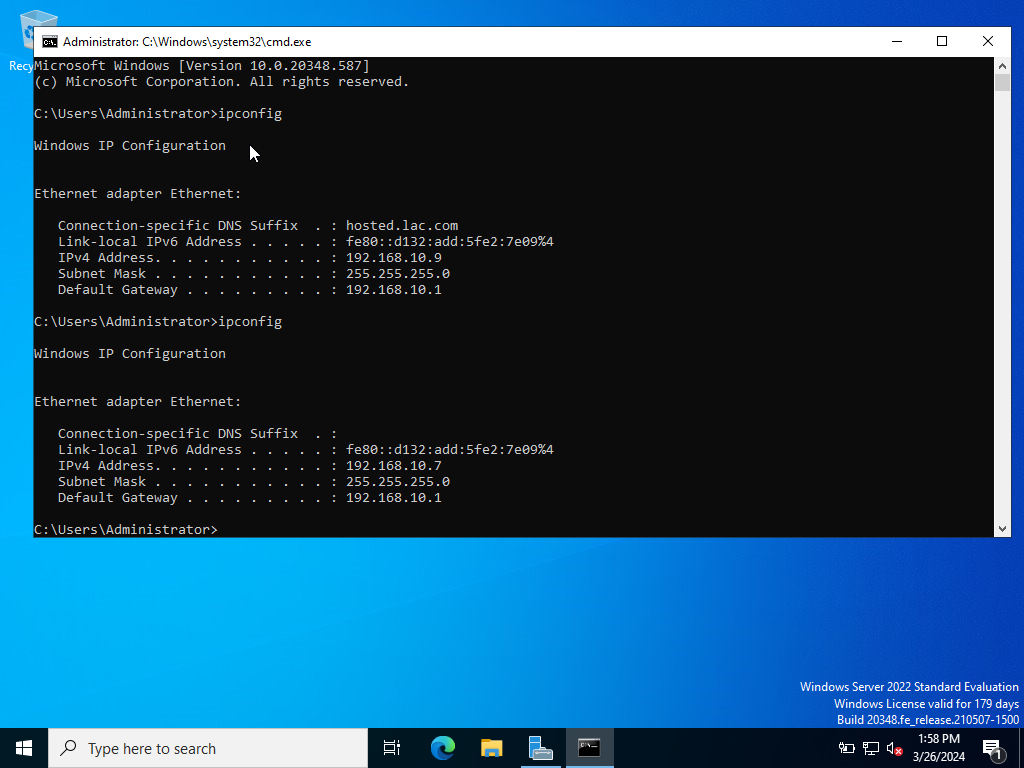
Now that we have set our proper network connectivity. It is time to install Splunk Universal Forwarder and Sysmon onto our Active Directory Server.
We will want to go over to splunk.com and login in with our credentials. Go over to free trials & downloads and download Splunk Universal Forwarder for Windows 64 bit.
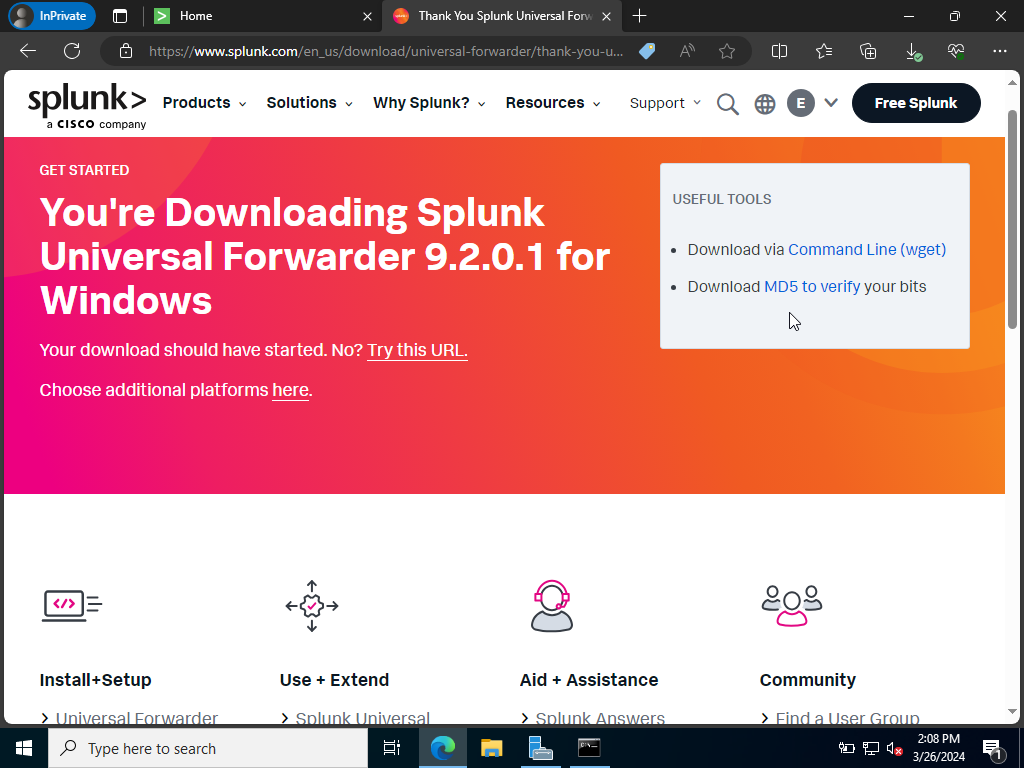
Once the download is complete let’s go over to the file and open the Splunk file to install the Universal forward onto our server.
Check the box to agree to terms with the default on premises Splunk Enterprise instance checked off as well. You may go ahead and click next.
Let’s create a ‘admin’ username. While, also checking for “Generate Random Password.”
We may also skip the deployment server by clicking next.
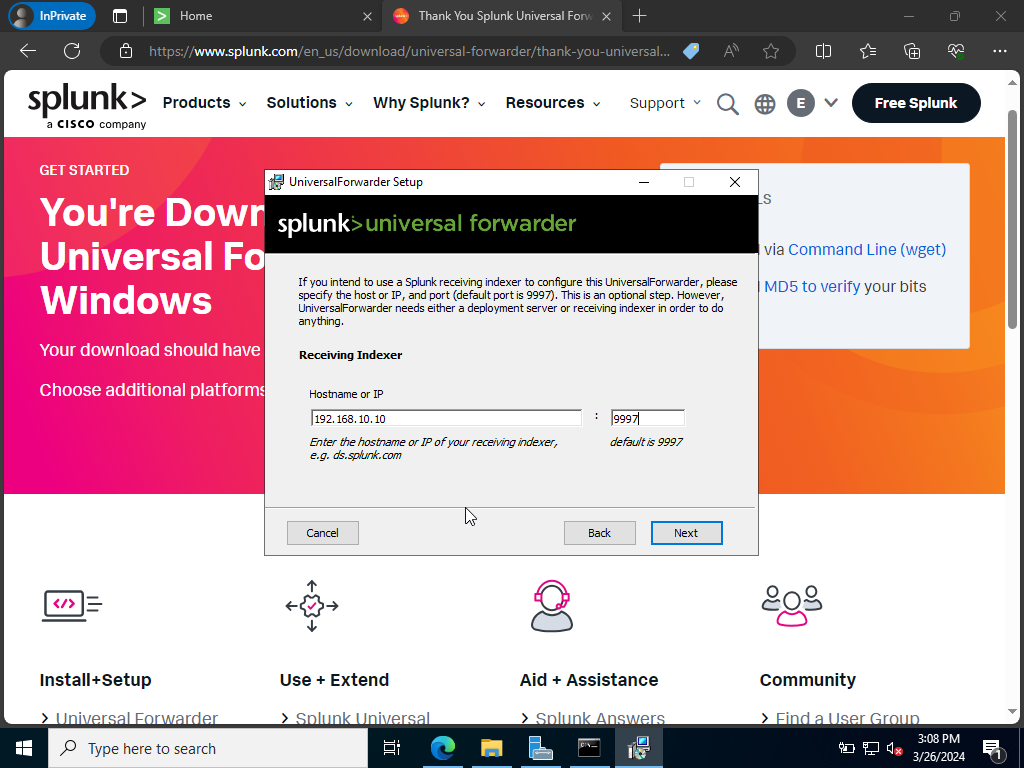
We will want to send all of our logs over to Splunk via the Receiving Indexer specifying our Splunk server IP and default port number 9997 shown above.
Click Next and Install. Now we will go ahead and install Sysmon.

Next we will save the inputs.conf file from this github repo. It’s already in raw file all we got to do is right click and save as ‘inputs.conf.’ Let’s put it into our Downloads folder and extract all of it there as well.
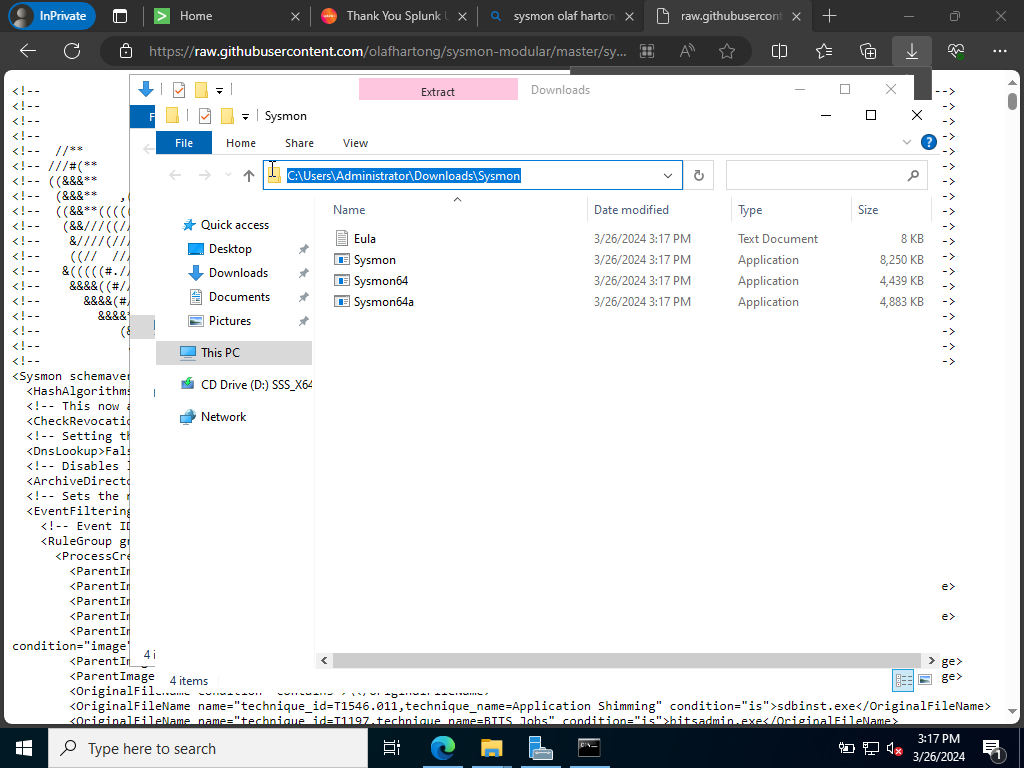
Let’s copy the file path and head on over to Powershell and run it as an administrator.
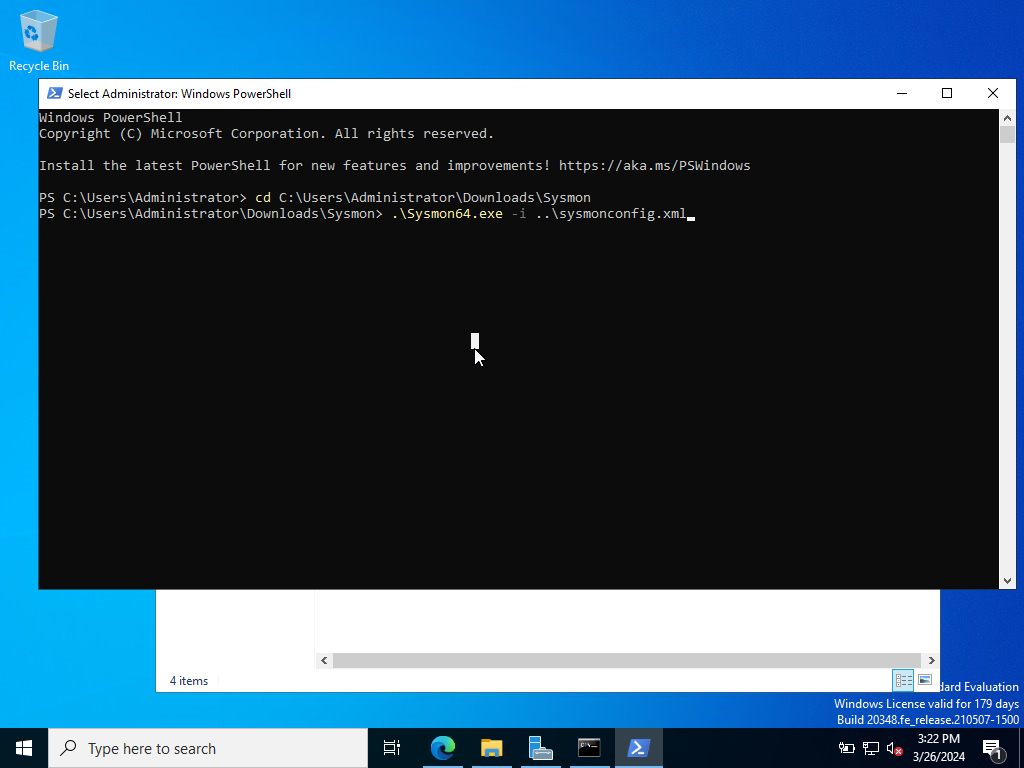
Now we will change directories into the file path where our Sysmon folder was extracted. Followed with the following command shown above to run Sysmon in conjunction with sysmonconfig.xml file.
Next, click agree to begin running Sysmon on our Active Directory server.
Now, here’s a very important step we must instruct our Splunk forwarder on what to send over to our Splunk server.
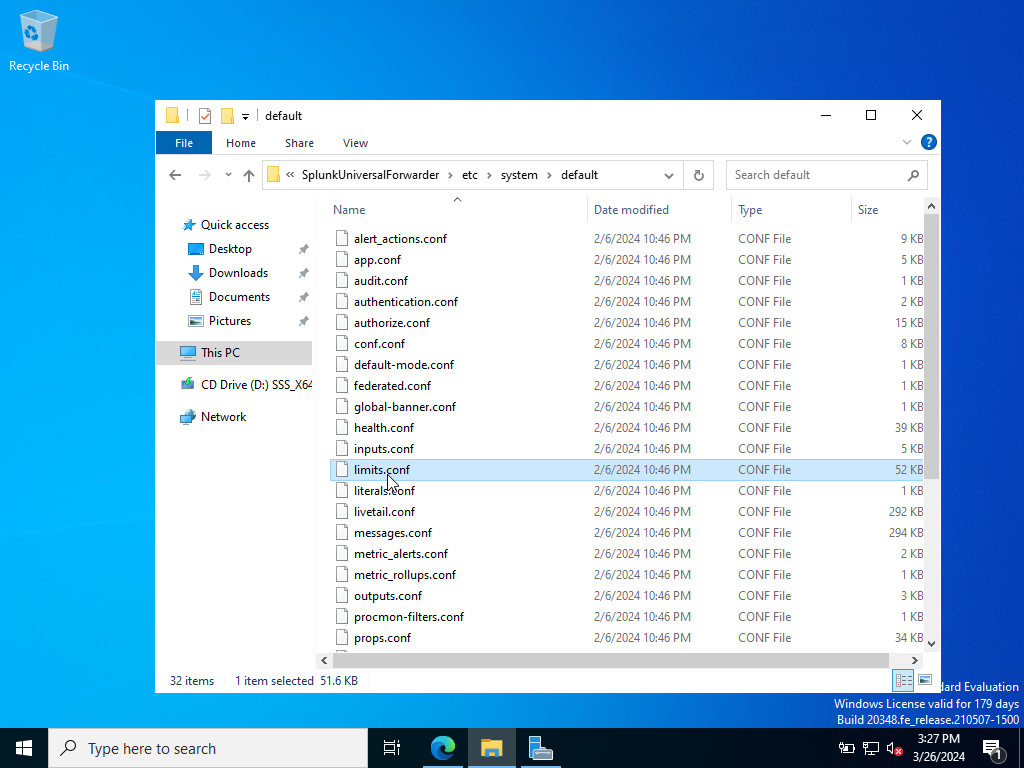
We will want to follow the file path shown above to locate the inputs.conf file in the default folder. We wouldn’t to edit in there because the default folder is considered a backup in case anything goes wrong. We will want to put the inputs.conf file into the local directory instead. We will need administrative privileges to do so.
Open up Notepad and run it as an administrator. Copy this Github repo’s .xml file code and paste it into notepad. It should look like this down below
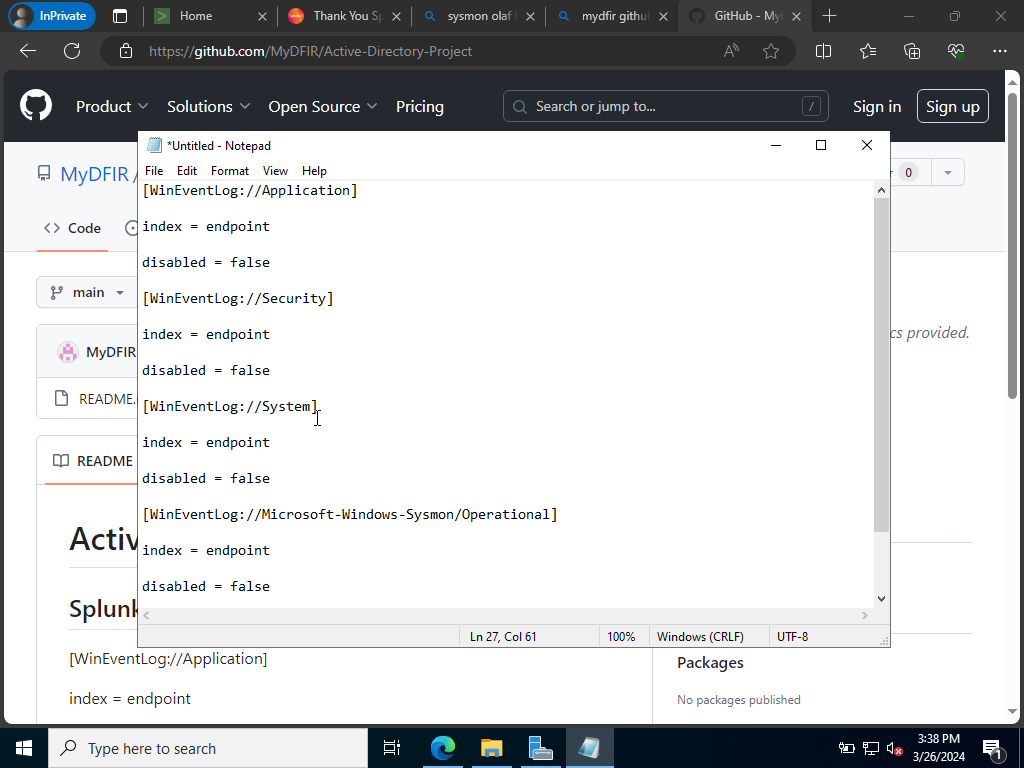
Let’s save it into our local directory.
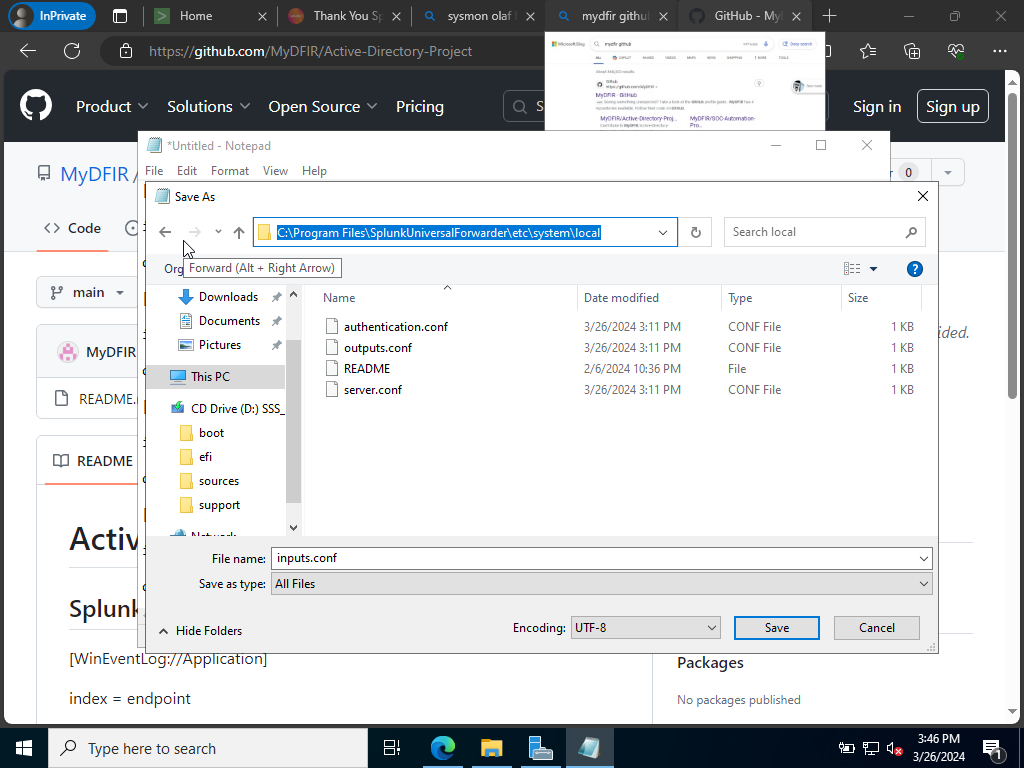
Again this inputs.conf file is instructing our Splunk forwarder to push events corresponding with Application, Security, System, and Sysmon operational to our Splunk server. The index is also being pointed towards “Endpoint” it will not receive the events under the Index “Endpoint” since we had already done so earlier we don’t need to again.
NOTE: Due to updating our inputs.conf file we need to restart Splunk’s Universal Forwarder Service in the “Services” settings.
Search in search bar “Services”>Run as Administrator> Splunk Forwarder (Type S)>Click on Restart Service
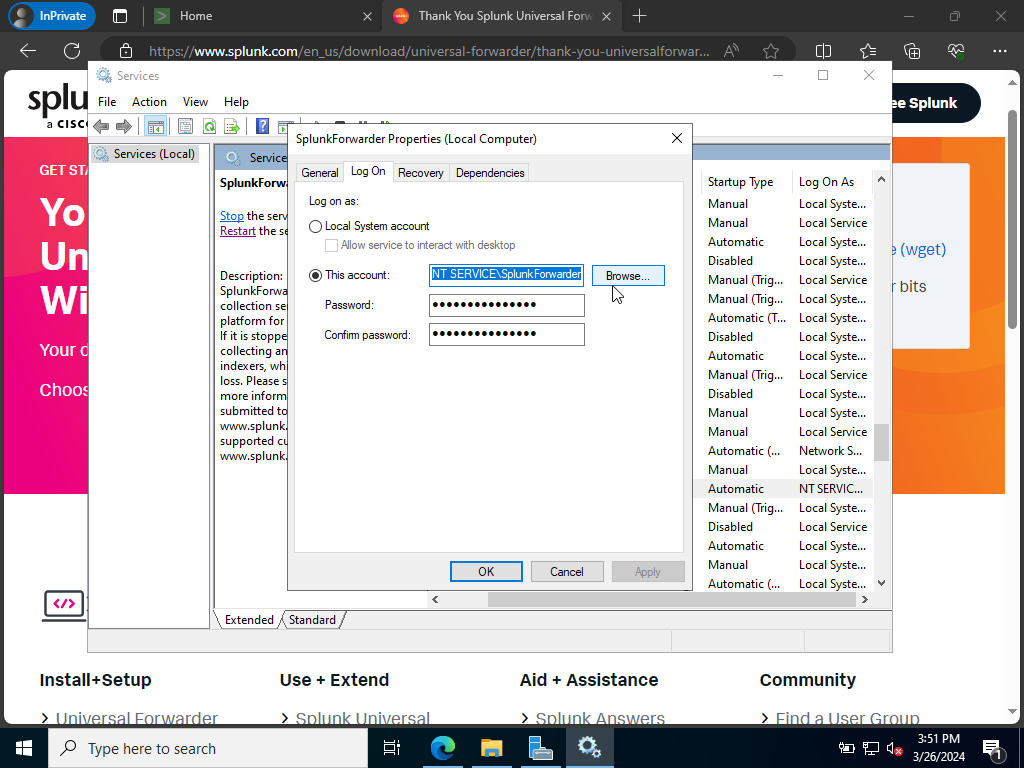
When you double click Splunk Forwarder and you see a NTSERVICE account it might inhibit log ingestions because of some of the permissions so instead we will want to log on via the local account instead by checking it instead.
Next, Apply the changes and click OK. It will prompt you to restart the service to apply the changes.
Let’s head over to our Splunk server to see if we began ingesting logs from both hosts. Remember, we had configured our Server earlier so we do not need to do it again.
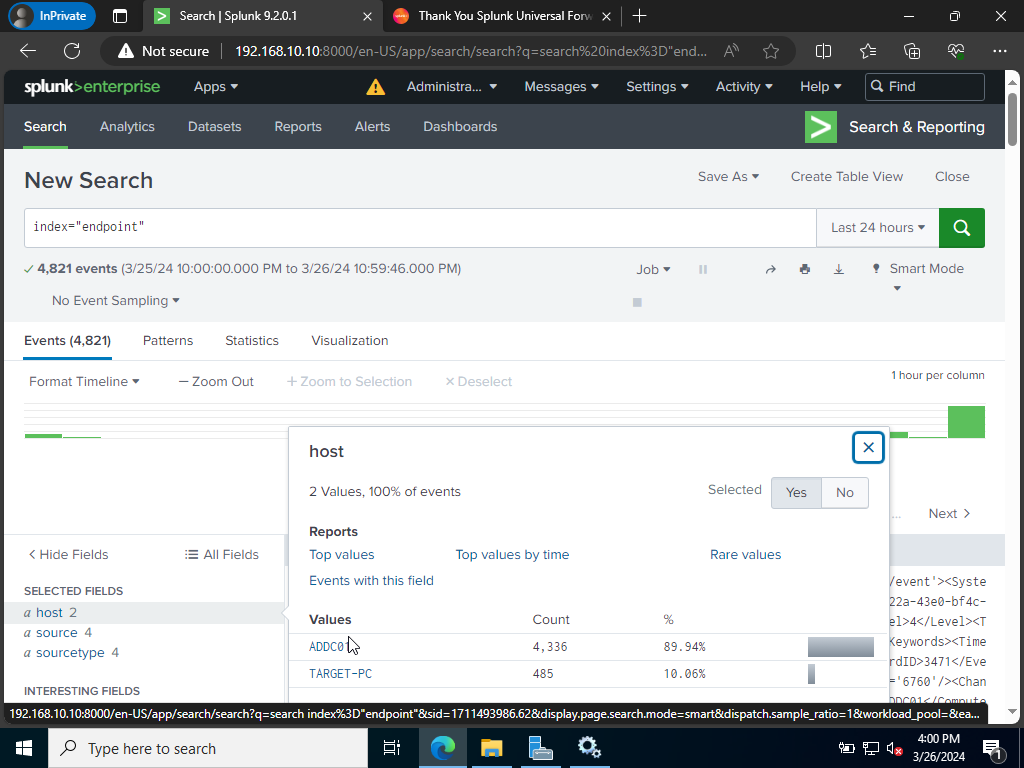
Success! We have added both our hosts to our Splunk server and should be ready now to begin receiving logs from both hosts as we please. This concludes our configuration portion of the project. Next, lab we will dive deeper into Active Directory! Remember, to be legendary!


