What is Wireshark?
Wireshark is a powerful network protocol analyzer that allows users to capture and examine network traffic in a GUI. (Graphical User Interface) It supports a wide range of protocols, including TCP, UDP, HTTP, and can be used to troubleshoot network issues, monitor network activities, and analyzing captured packet files. The software is open-source and available for various OSs’ including Windows, Linux, and Mac.
Installation
Kali Linux (Debian)
We are going to be using Kali Linu for this lab. Usually it will come pre-installed already but, if you so happen not to have it in your Debian repository. Follow this command:
‘ sudo apt install wireshark ‘
That is all to install it after you run the command! For windows just download the setup file and install it.
Getting Familiar with Interfaces
If you are not using it on Kali Linux, it is very important to run Wireshark with administrative privileges (sudo) to ensure it has the necessary permissions to capture packets. When you launch Wireshark for the first time, it will look like this:
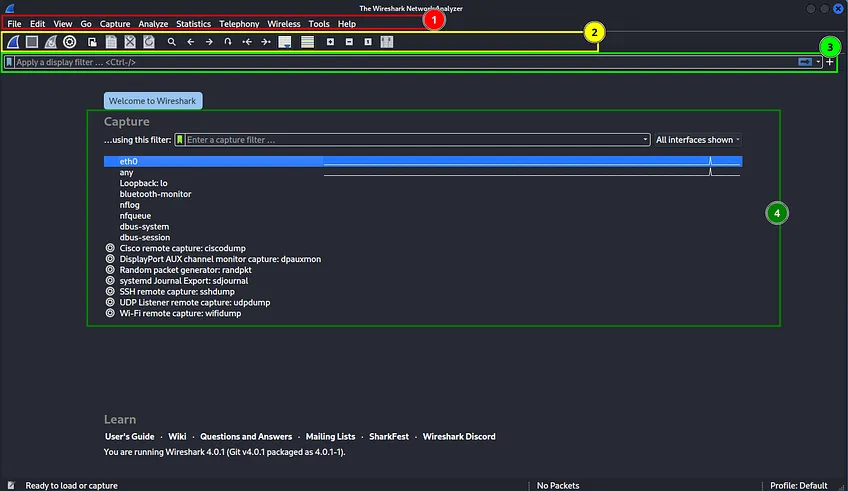
We have the menu (1), the toolbar (2) with the most common tools, you can hover over them to see their usage (do it now) to get familiar with it. The search bar where we can search for packets with or without filters (3), and available interfaces to capture packets.(4) Those are the essential things to remember for now. As we go further we will learn more advanced aspects about Wireshark.
Now let’s capture some packets. Select any interface for my case it’s eth0
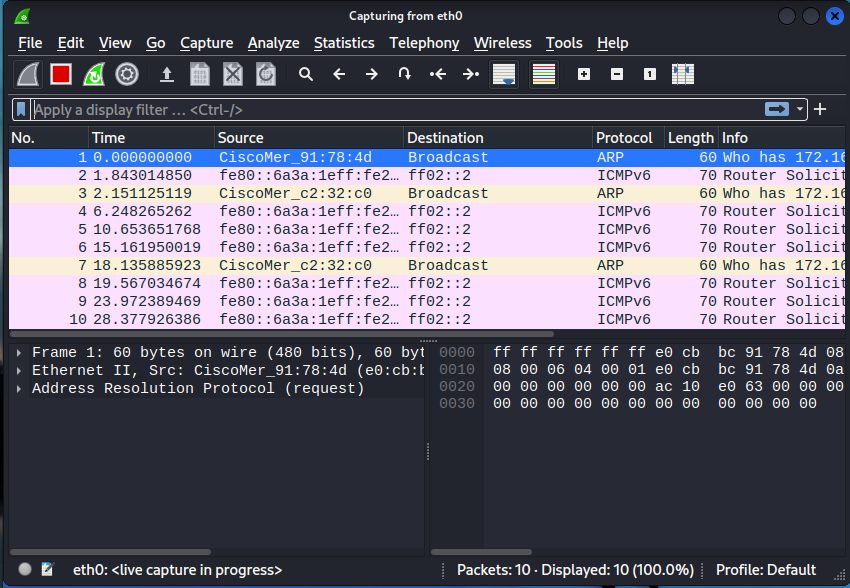
In my case it’s going to be capturing traffic because I am on a public network at a Starbucks. I am getting traffic from all users here using the network. Usually if your on your own network you might not be getting any traffic. Try pinging google 8.8.8.8 using the ping command.
You should see the blank space filling up with packets captured from pinging google.
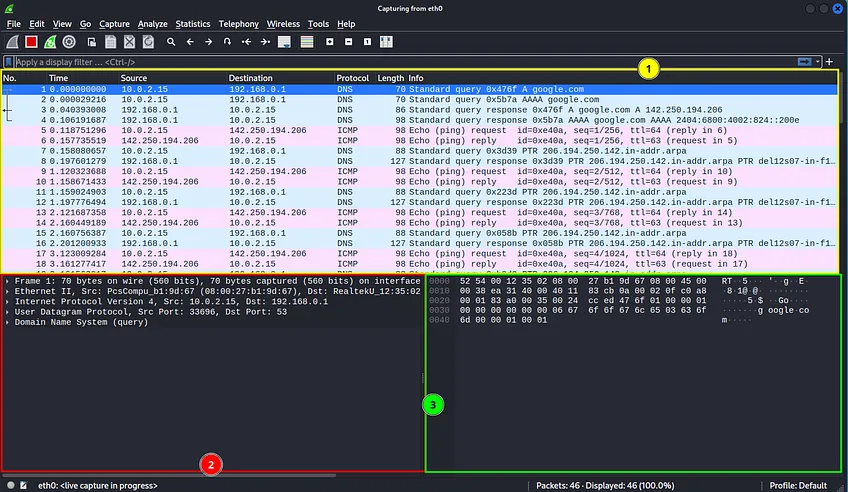
First, we have the main section where will visualize all packets captured (1). Here we have 7 columns with information on the sequence number, Time, Source, Destination, Protocol, Length, and Info.
Then there is the packet details section (2) where you can see more about a packet just by clicking it. After that we have a section where we can see each packet’s byte form.(3).
At the very bottom, we have an info section where you can see where the packets are from, the total packet number, and the selected profile.
Before we go into packet analysis, let’s stop the packet capture by clicking the stop button.
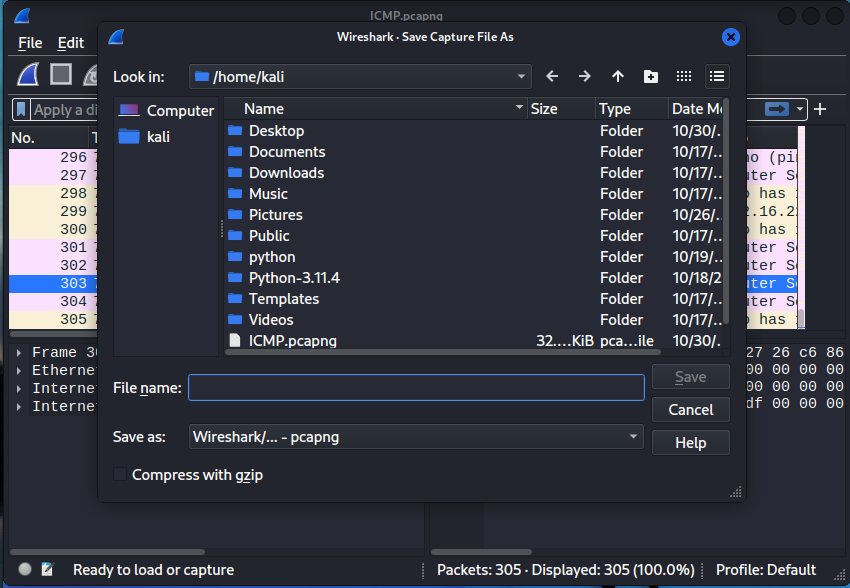
Now let’s save the packet we captured. You can do this directly from the toolbar, or from the menu bar we just learned about.
Select the location and filename and save it.
Protocol Analysis
Now let’s get into some basic protocol analysis. We should know how the common protocols work if not, i highly recommend and learn about computer networking.
Now click on the protocol platform column, It will sort out the packets. From there we can see there are three types of packets, ARP, DNS, and ICMP. This is the result of our last packet capture.
ARP
As we already know ARP (Address Resolution Protocol) is used to know the MAC address of an IP address. It will only request it if it doesn’t find the destination’s IPs MAC address in the ARP cache.
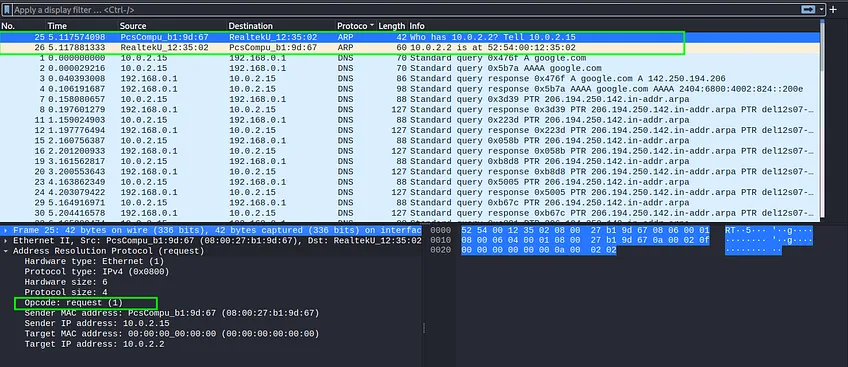
As expected the first request is asking ,“Who has 10.0.2.2? And to tell 10.0.2.15(us)” And on the second request, it tells that the IP ” 10.0.2.2 is at 52:54:00:12:35:02 (physical address).”
ARP has two types of operation code request (1) and response (2). You can also get other information by expanding the clickable items.
DNS
DNS is used to get the IP address of a domain name. And if a domain’s IP address is not found in the DNS cache it will perform a DNS request.

First, we are asking google.com for it’s A or ipv4 address, and then AAAA or IPv6 address. After that, we see that we have two responses including the IPv4 and IPv6 addresses.
By default, DNS uses the UDP protocol to send its data. It can also use TCP. You can see more detailed information by clicking said items.
ICMP
The ICMP packets have two types of packets, request with type 8, and reply with type 0. Ping uses ICMP to check if a machine is alive and working. It can also be used to exfiltrate data as well by bad actors.
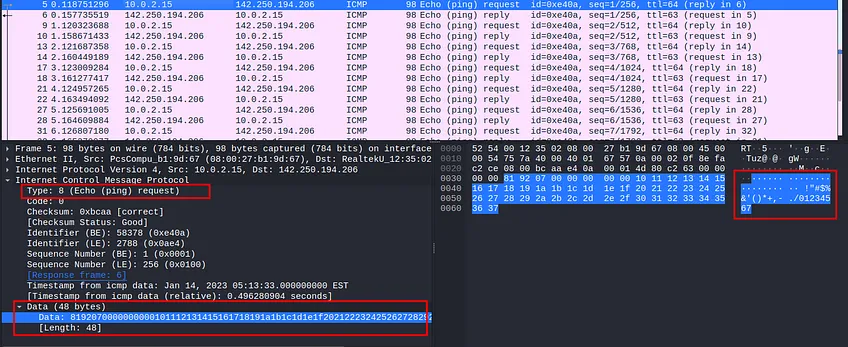
Note: For any data type always look at the flow of data, source, and destination address.
HTTP
In most cases what you will be dealing with is HTTP/HTTPS traffic. Let’s start the packet capture again and open your web browser, we will be searching for anything on google any sites that use HTTP and HTTPs.
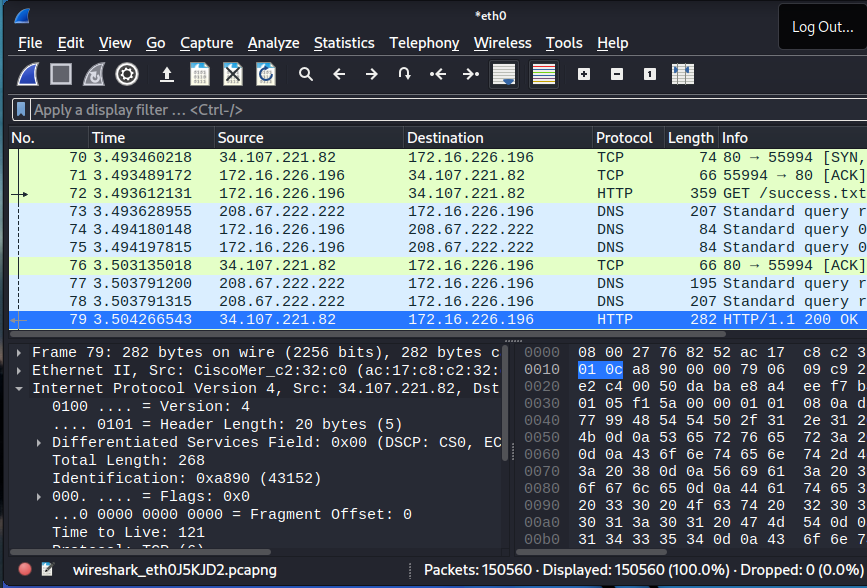
Just within a couple minutes, we captured over ~150k packets. (AT THE BOTTOM) Now there are many types of protocols but it’s not feasible to look for a certain traffic type from top to bottom. Maybe for a few hundred, not for thousands!
For that we have an option to sort it out. From Menu -> Statistics -> Protocol Hierarchy. This will show the statistics of protocols.
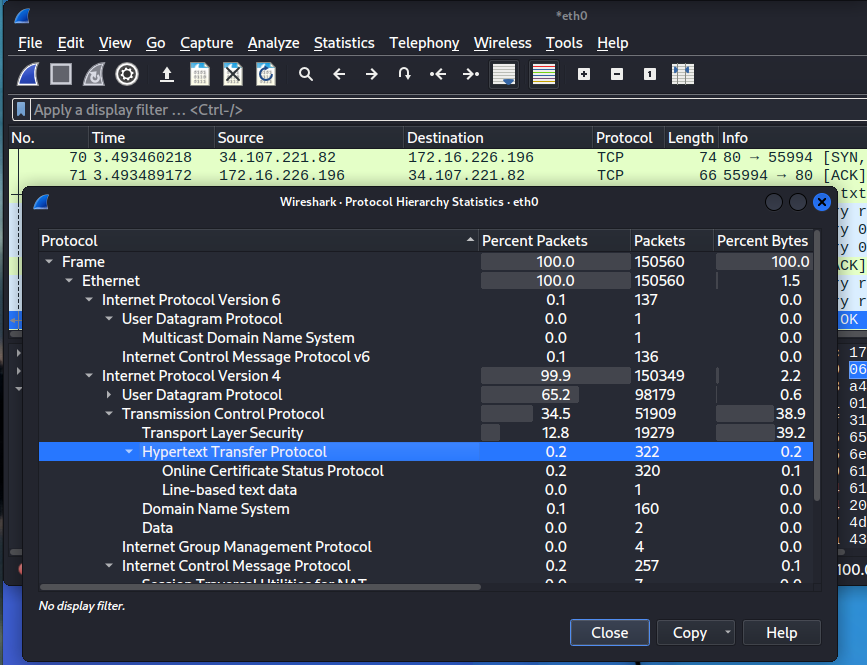
This includes all the protocols in a binary tree format. It includes the protocol’s name, total packets in specific protocol, and other necessary information. This will give us a high-level understanding of what we are dealing with.
You can right click on the protocols to see more options.

Right click on HTTP, and click apply filter to select one. This will filter only HTTP traffic from pcap file.
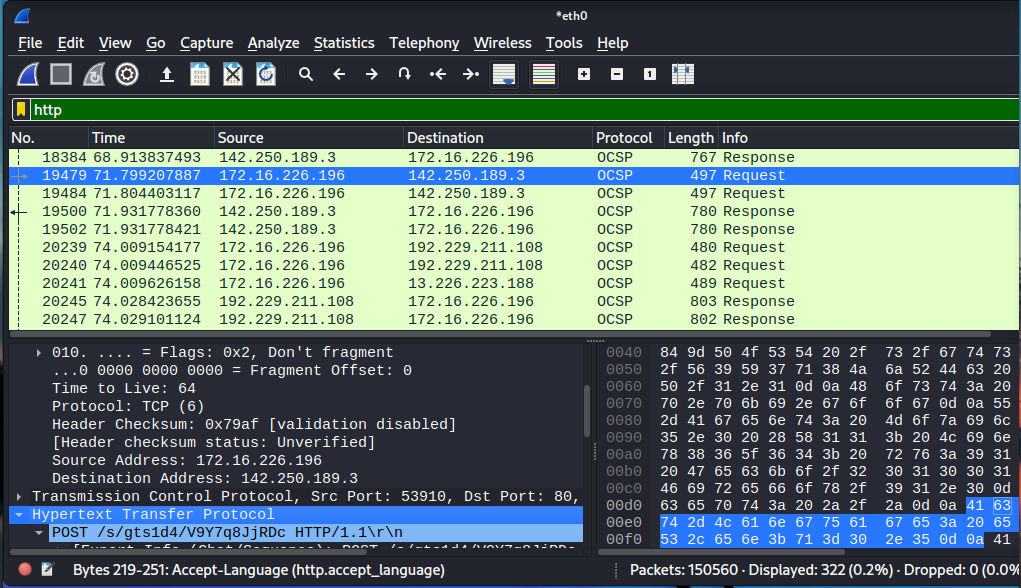
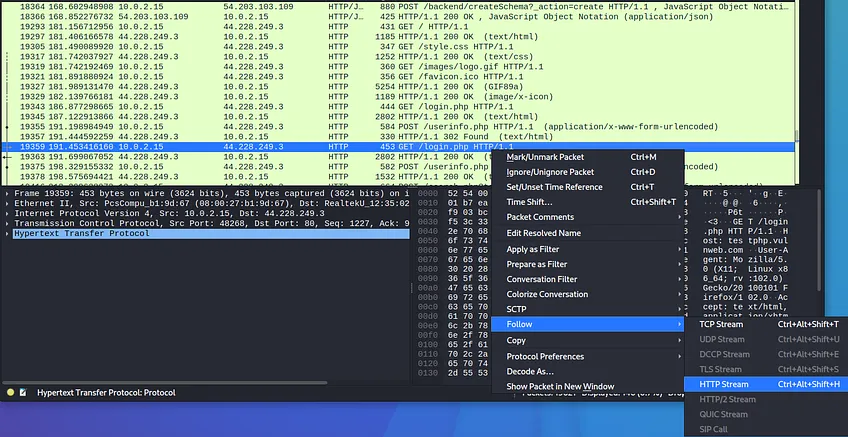
Now we have all the HTTP packets, the OCSP also falls under the HTTP protocol. Now select the 19479th packet->right click-> Follow-> HTTP Stream. ( or any packet)
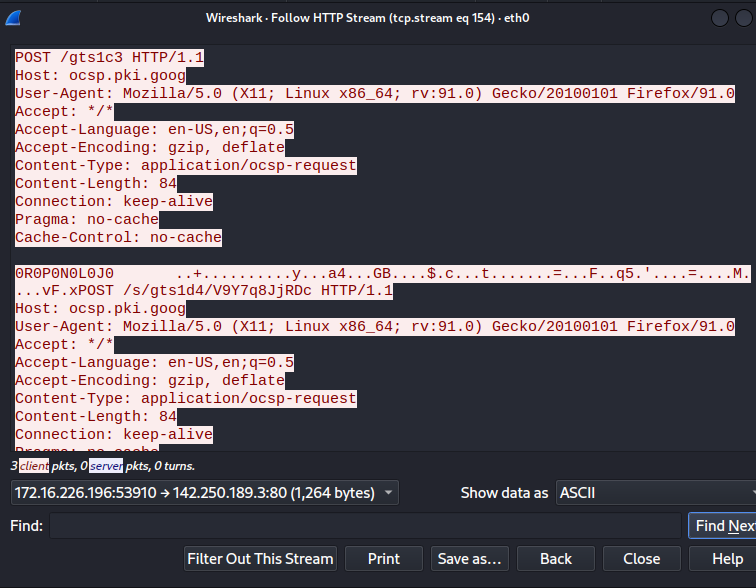
What we have here is the red color text is from the client (request), and the blue color text is from the server(response).
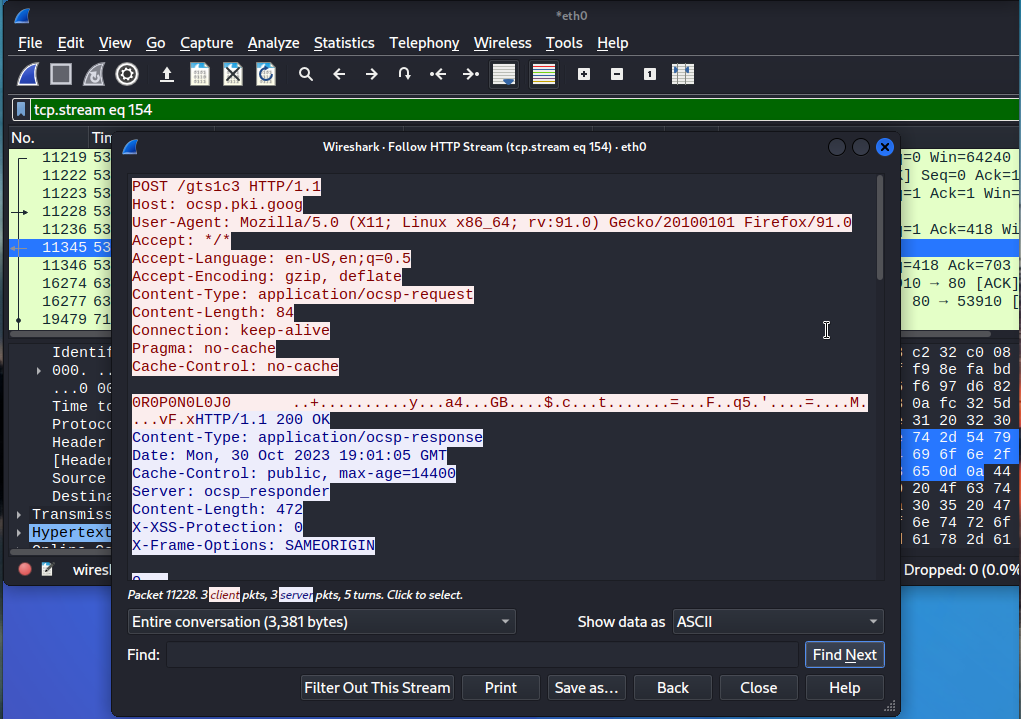
In my case it’s just the OSCP request and response. As we scroll down it responds to the applications GET request and gives it the cache it needs to acknowledge said request.
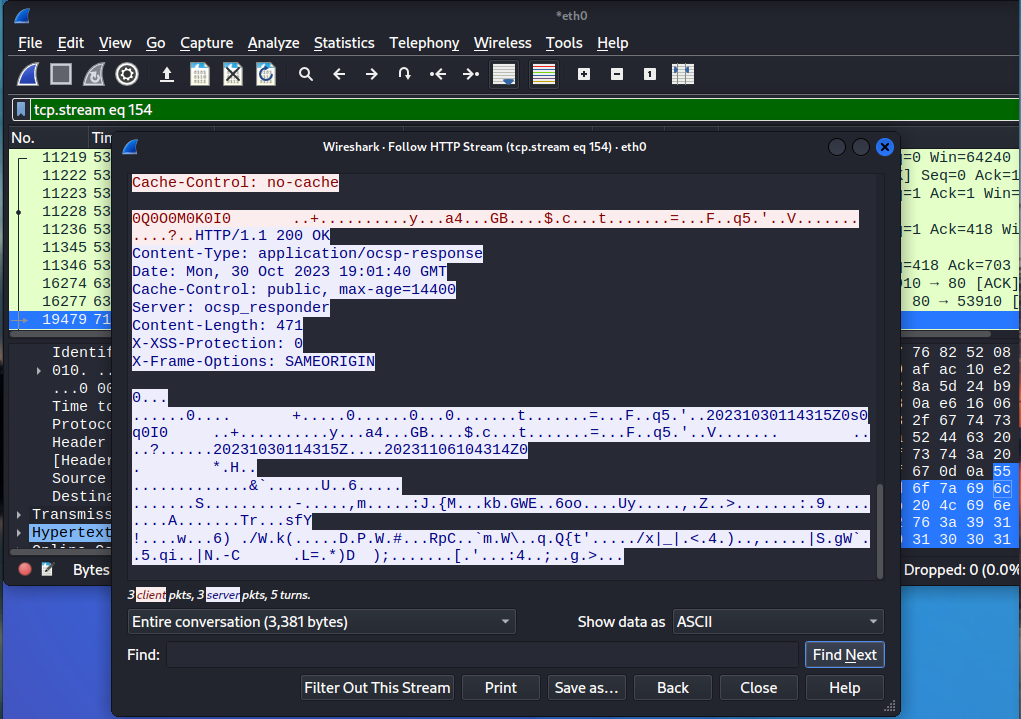
You can also view this request or response by changing the selection from the bottom left corner.

In our case it’s sending it’s GET request from 142.250.189.3:80 and it receives it’s ACK response from 172.16..226.196:53910 and tells machine 142.250.189.3:80 that it has acknowledged it’s request.

It will enable us to see all the requests or responses at once and all it’s data.
This will be helpful for a quick overview of all requests.

This example will help us dissect the packet using the packet filter settings shown above while the packet is on stream, you can search for strings like pass (1). By default packets will be shown in ASCII form but this can be changed by clicking ASCII and selecting what you need(2). This will filter out the selected packets from the packet list, this will not remove it from the file, only a temporary filter(3). Clicking ‘print’ will get you to your printer if available or else it will allow you to save the packet as pdf(4). ‘Save as’ will allow you to save the selected packets(filter will apply)(5).
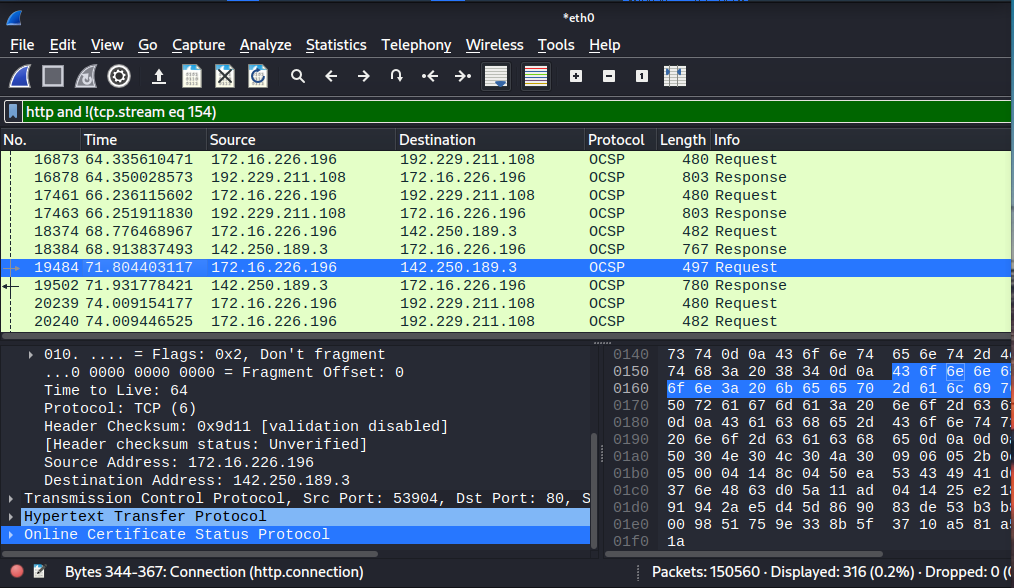
This is what happens when you click filter out the stream button (3), it uses the operators and filters the specific packets from showing on the list.
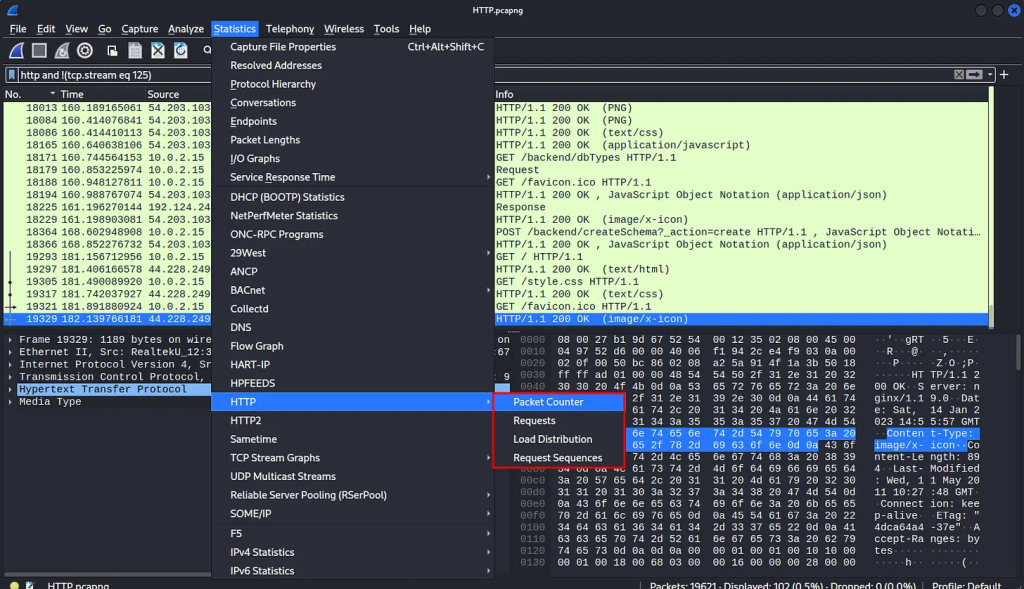
You can also go to statistics and try out the options, the requests option will show you all the requests on any given site. This will be helpful in determining what was accessed through the host.
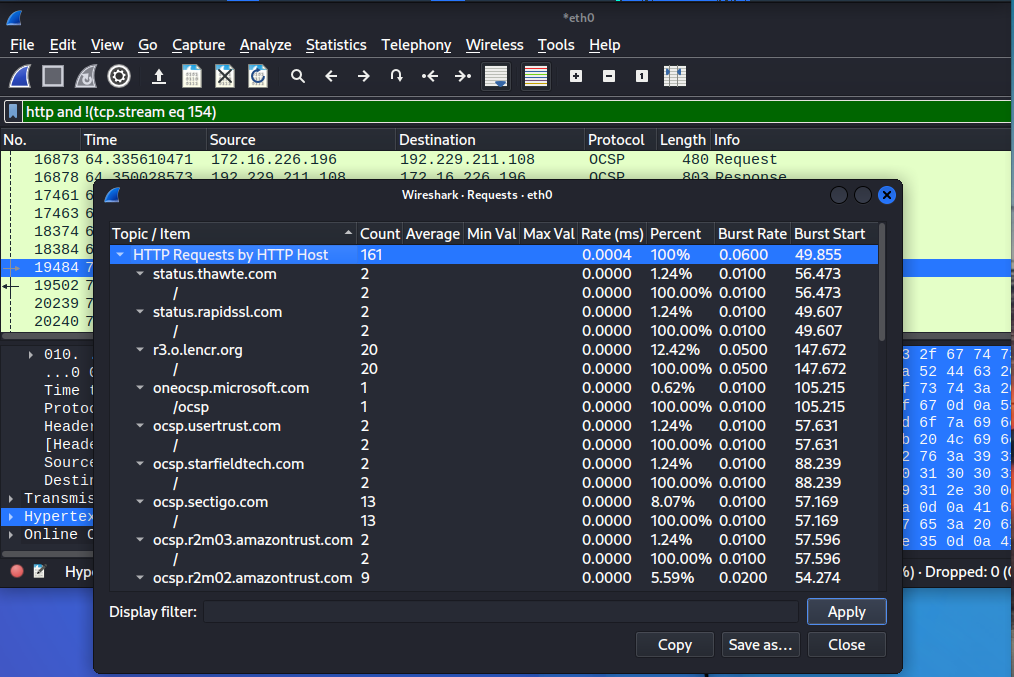
The requests sequence will show the request in the sequence they were performed. This is useful because the data flow will be in order and will be easier to focus on where you want to look since it’s in order.
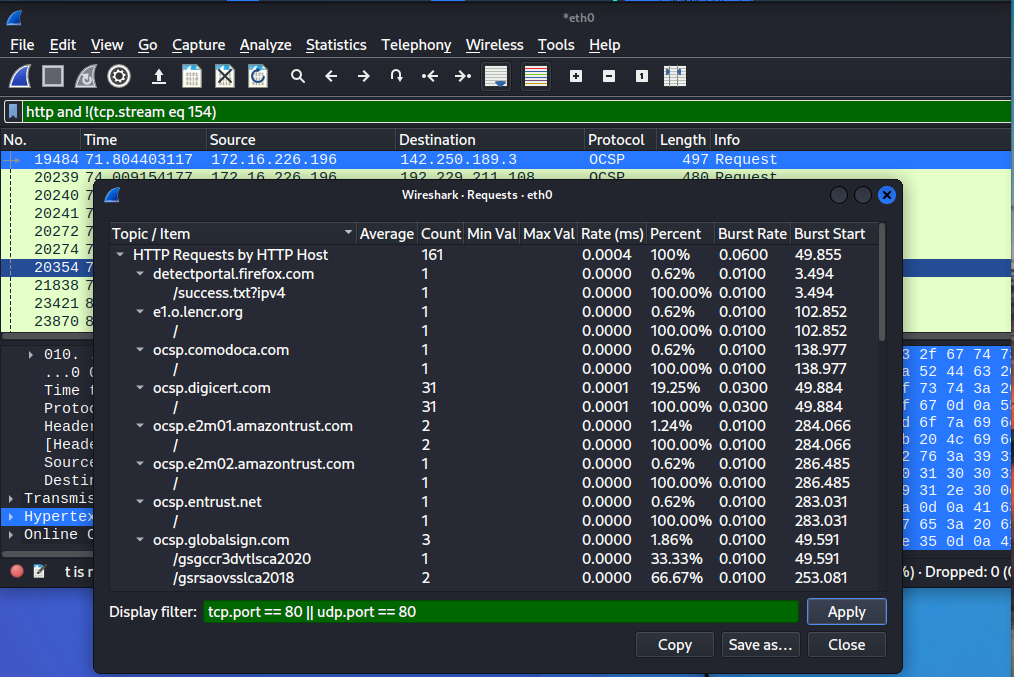
Play around with the filters and notice the difference.
HTTPS
Until now we’ve only seen a basic analysis of HTTP traffic, what about HTTPS? By default, HTTPS traffic won’t make any sense inside of Wireshark. To analyze encrypted traffic we have to decrypt it first. We are going to run a lab and capture said HTTPS traffic.
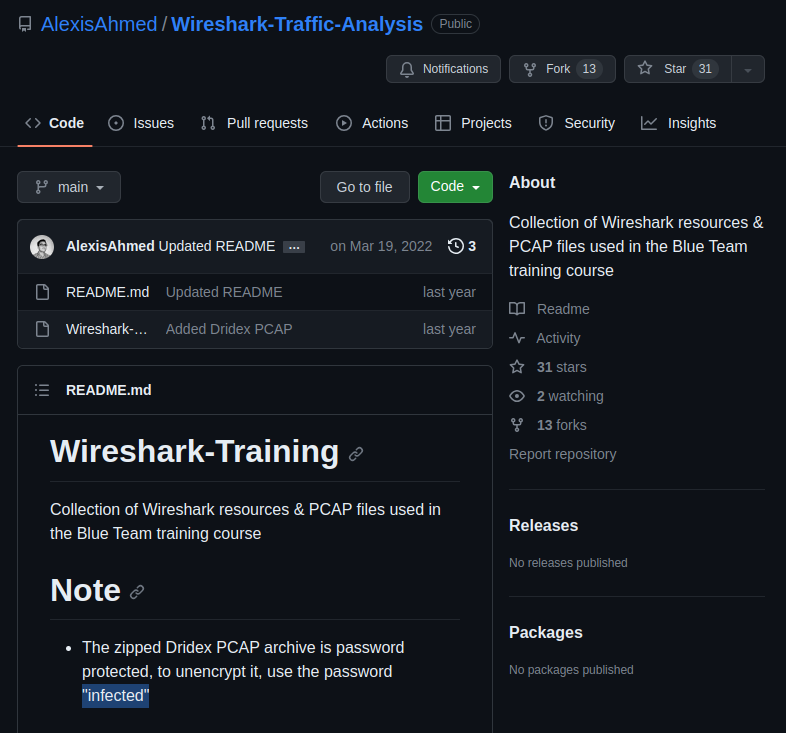
Here’s the link to download the zip file: https://github.com/AlexisAhmed/Wireshark-Traffic-Analysis/tree/main
The password for the zip file is “infected.”
We are going to extract said file using a extraction manager.
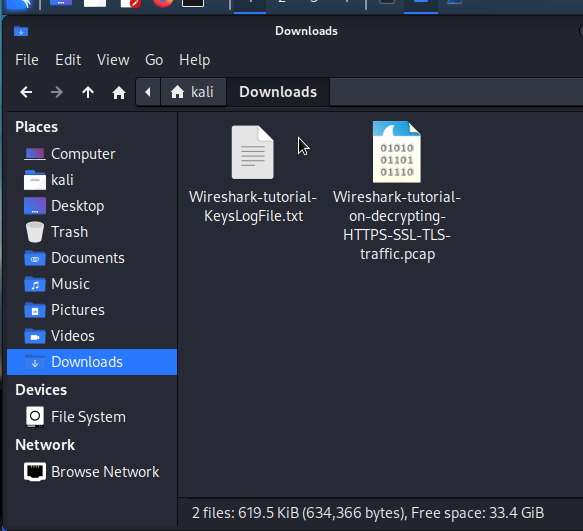
We should have the SSL keys captured in a hypothetical Man in the Middle attack. Also alongside it the PCAP file. We can now open it up. Right click and open it up with Wreshark close your current session if it’s still open.
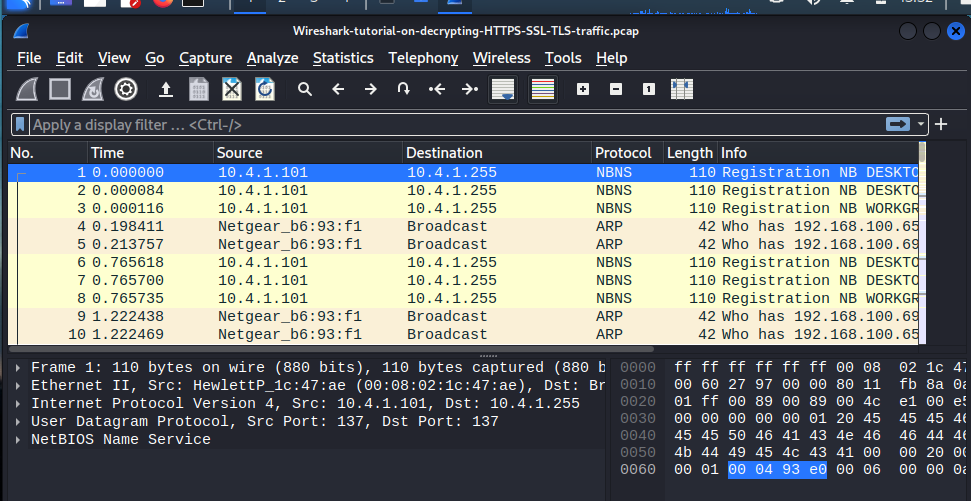
Should look something like this. Now we’re going to head into MENU-> Edit->Preferences.
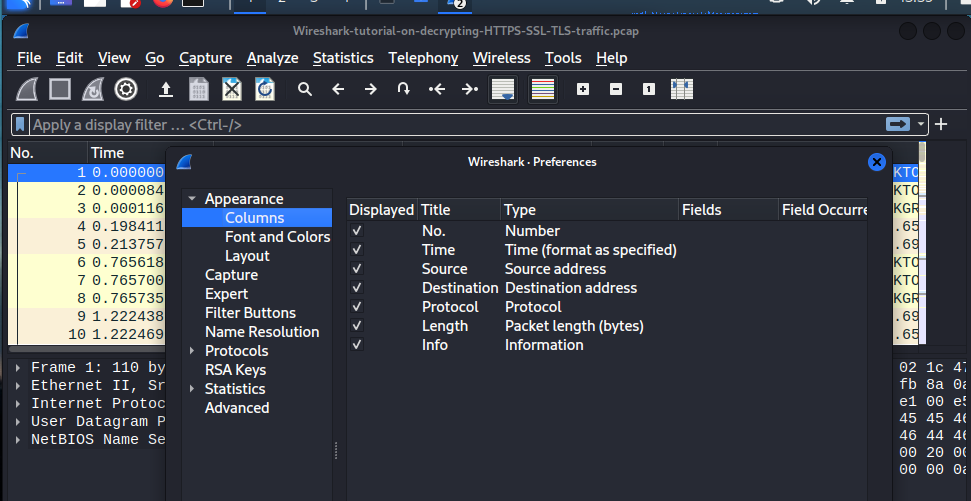
By default, it should have the ‘source’ and ‘destination’ columns already displayed, but just in case it ain’t we can configure the settings to displays the columns as we’re going to need them. We are next going to align the source and destination columns by right clicking those two columns and ‘clicking align center’. To be able to see what’s going on.
The objective is to essentially decrypt communication between a particular system. We don’t know much about the network as you may see it’s on a different subnet. As an aspiring blue teamer more than likely you will be presented with a pcap file and told to analyze it, identify the infection, and report on it.
We can begin to use a useful filter ‘tls.handshake.type eq 1‘ essentially what this does is look for successful handshakes. As we can see a couple handshakes that have been successfully established via TLS protocol version 1.2

They are going to encrypted so we are going to Follow the tls stream. It’s going to be empty when we do. We are going back to our original filter of ‘tls.handshake.type eq 1‘and Follow the TCP stream instead.
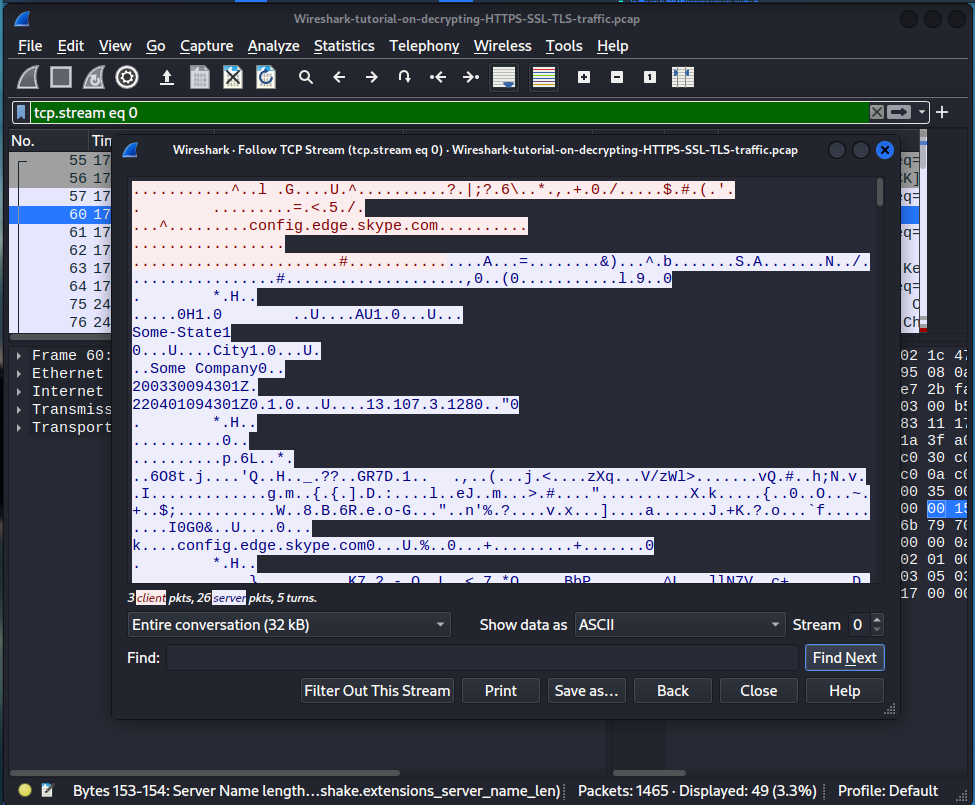
As we see here it’s a bunch of jibberish. This is the encryption protocol’s cache and this is how it’s being done to encrypt it. We will need the SSL keys to decrypt the encrypted traffic. In order to decrypt them what we want to do is head over to MENU-> Edit->Preferences again.
Under protocols we are going to search for TLS.
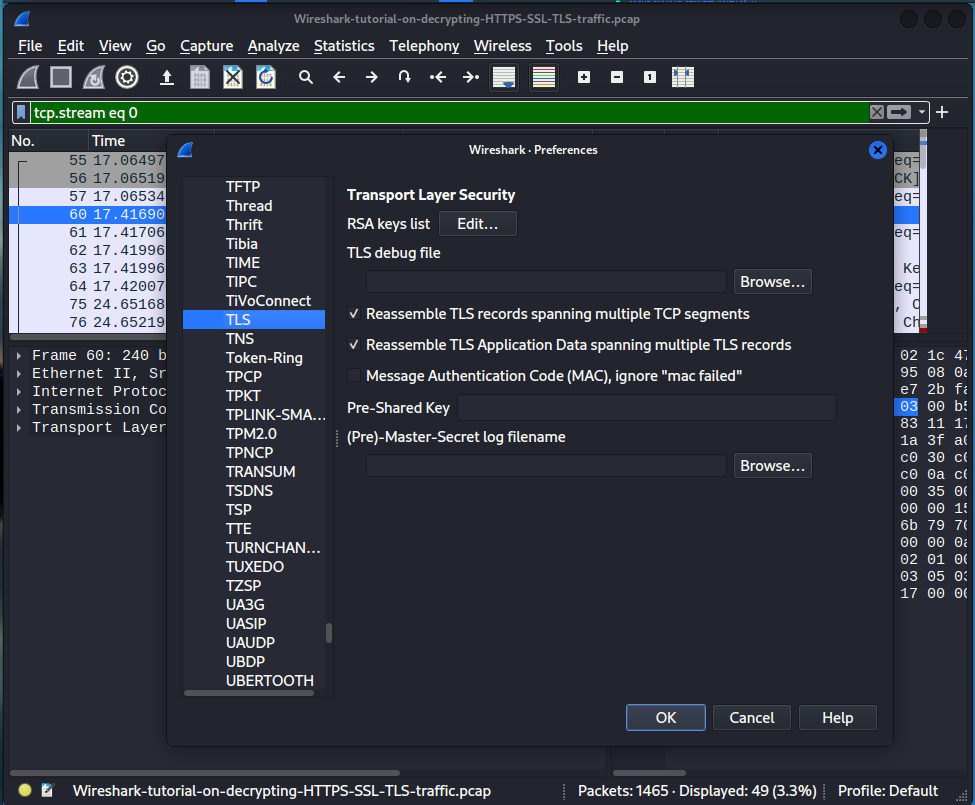
We are going to click on Browse and go into were we saved our ‘keylogsfile.txt ‘and open it. Hit ok in preferences.
Now if we take a look at the ‘tls.handshake.type eq 1‘ filter again. Follow any stream again and click TCP stream you will still see that it’s still encrypted.
If we go back to our ‘tls.handshake.type eq 1‘ filter again. Follow any stream and click TLS stream you will see now it’s decrypted.
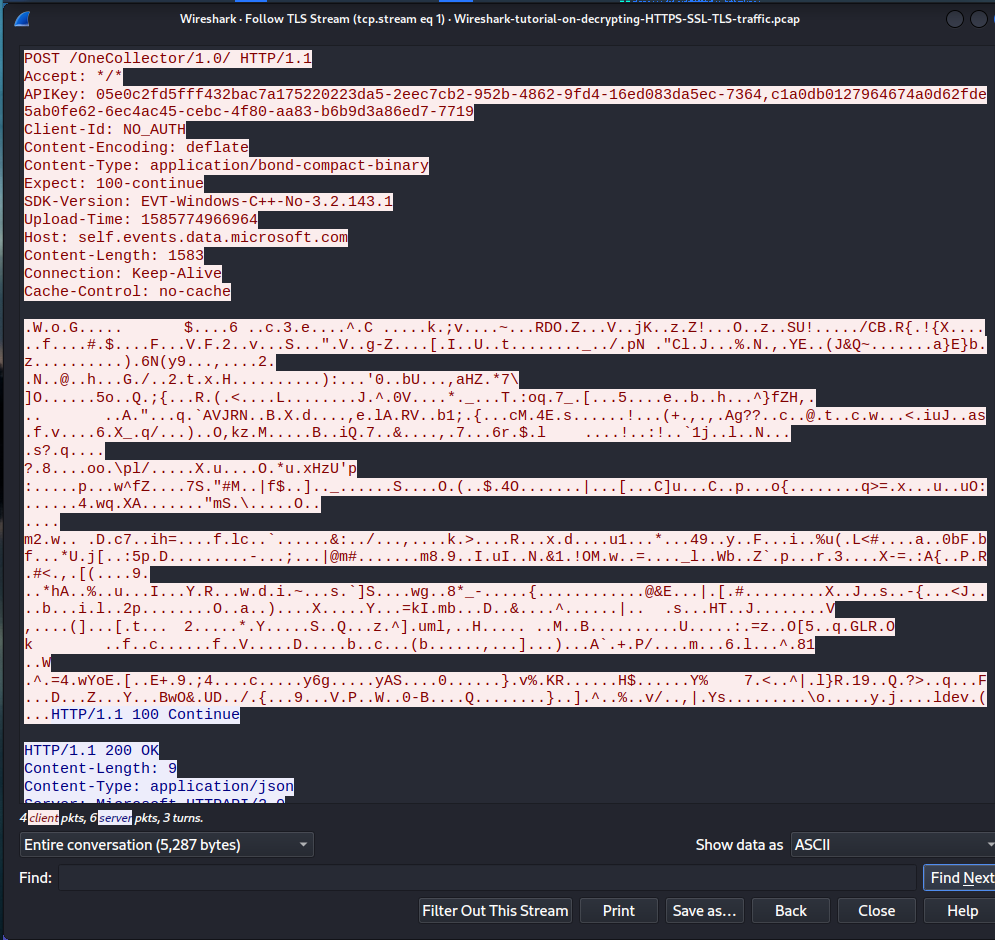
Now we can see the post requests here now. Our objective now, is to find out what system was infected and what malware type caused the infection.
What we’re going to do now is use a filter ‘(http.request or tls.handshake.type eq 1) and! (ssdp)‘
The brackets signifying we only want these search requests. The ‘or’ operator signifying we only want these two requests of HTTP and TLS. The ‘and!’ operator is meant to exclude. We made another bracket again excluding the protocol SSDP.
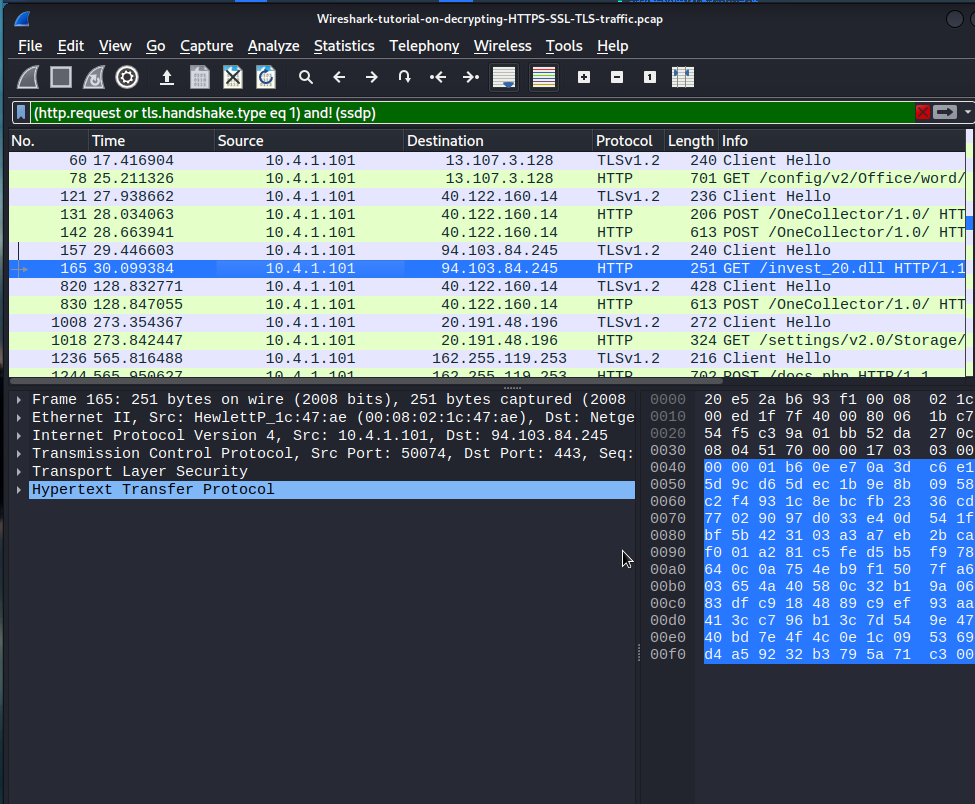
If you see on NO. 165 and see the info section of said packet. You can see that machine is trying to get a GET request for a dll file. It’s called invest20.dll. The type of malware we are dealing in this case is the drydex malware. You may research this malware on your own but essentially it’s a malware that effects financial institutions. TYpically it’s actual point of infection method is through a particular office documents; specifically spreadsheets and what it does, is downloads specific tools or utilities that are used to download the final piece of the malware. In this case we have a dll here.
Once we identify the dll we can click on it and follow the http stream on it.
You can see that it’s downloading or it’s making a get request for this dll and there’s a response saying okay. The server was able to find it and we have this octet stream or application containing the data within the packet and it looks to be the actual dll because we get the actual DOS stub here. It specifies the program cannot be run on DOS mode.
As a malware analysis or a threat hunter we would analyze the content of the dll file through a program like ‘VirusTotal’. How would we do this?
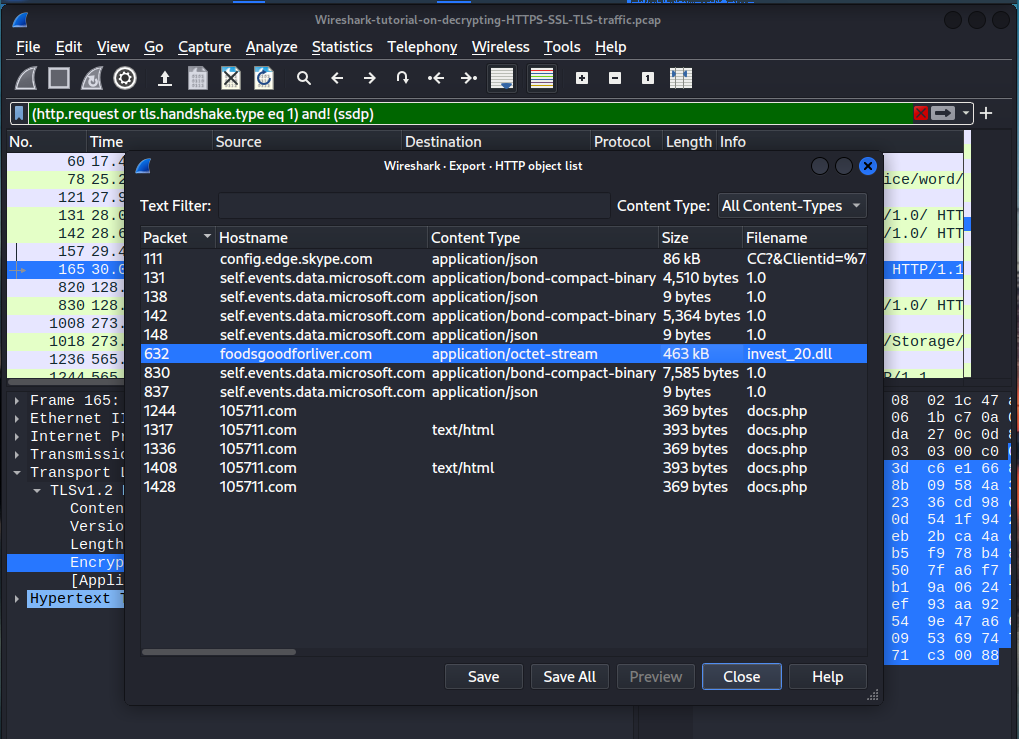
What we can do is export this an object. We’ve already decryped it already so we can export this packet as an object.
What we’re going to do is click on the particular packet containing the dll file. We are going to get rid of our current filter. We will go back to our previous filter of ‘(http.request or tls.handshake.type eq 1) and! (ssdp)‘ .
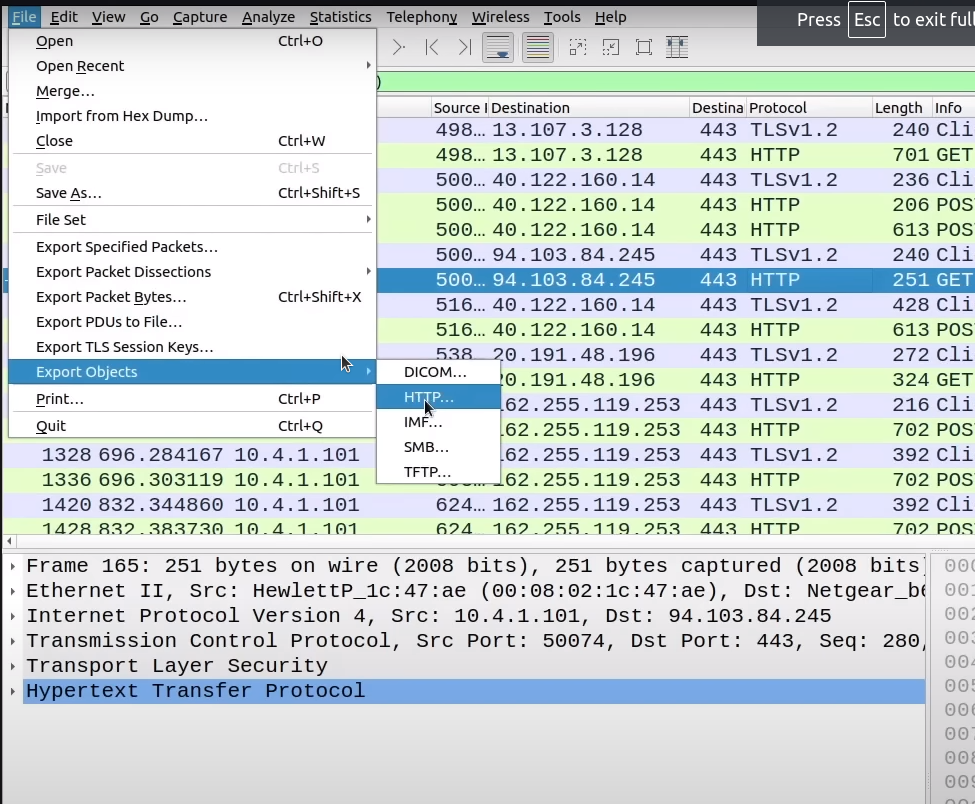
We are looking for the file containing invest_20.dll. Click on it. Save it on your desktop as ‘invest_20.dll’.
Now, we’re going to utilize a service like ‘VirusTotal’. Here’s the link click on it https://www.virustotal.com/gui/home/upload and upload the file onto it.
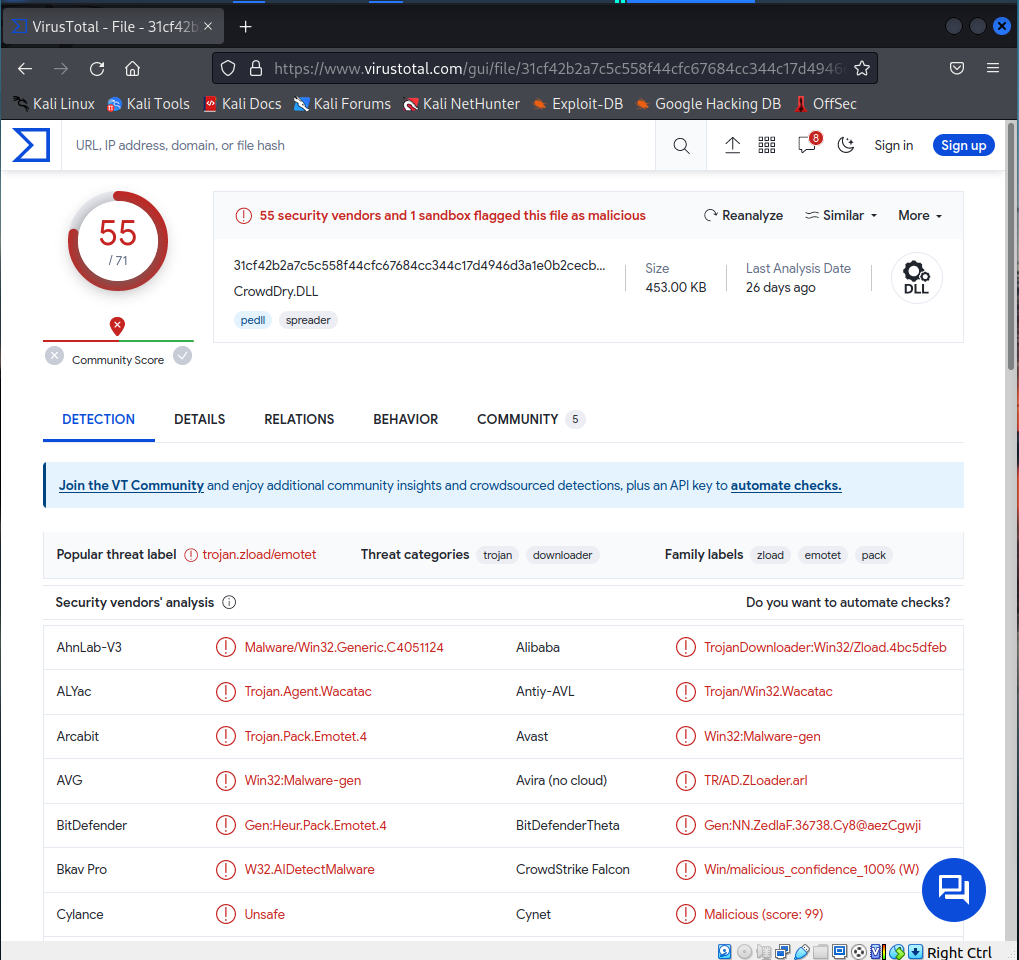
Crowddrive.dll is the original dll and you can learn more about it here. So you can see that its a win32 dll portable executable. You can also identify more information regarding when this particular piece of malware was created. We can also see what dlls or win apis it imports. Right there also shows you that its quite malicious because it utilizes the kernel 32 dll there and a few others like ws32 dll. If your familiar with malware analysis this is how you would typically go about doing this.
If we switch over to the Relations tab. The way it’s being executed is via an office open XML document. More than likely getting users via a phishing or spear phishing attack. In which it executed the macro more than likely executing code to get into the system.
If we go back to our ‘(http.request or tls.handshake.type eq 1) and! (ssdp)‘ filter. If we take a closer look at some very interesting post requests to this servers IP here.
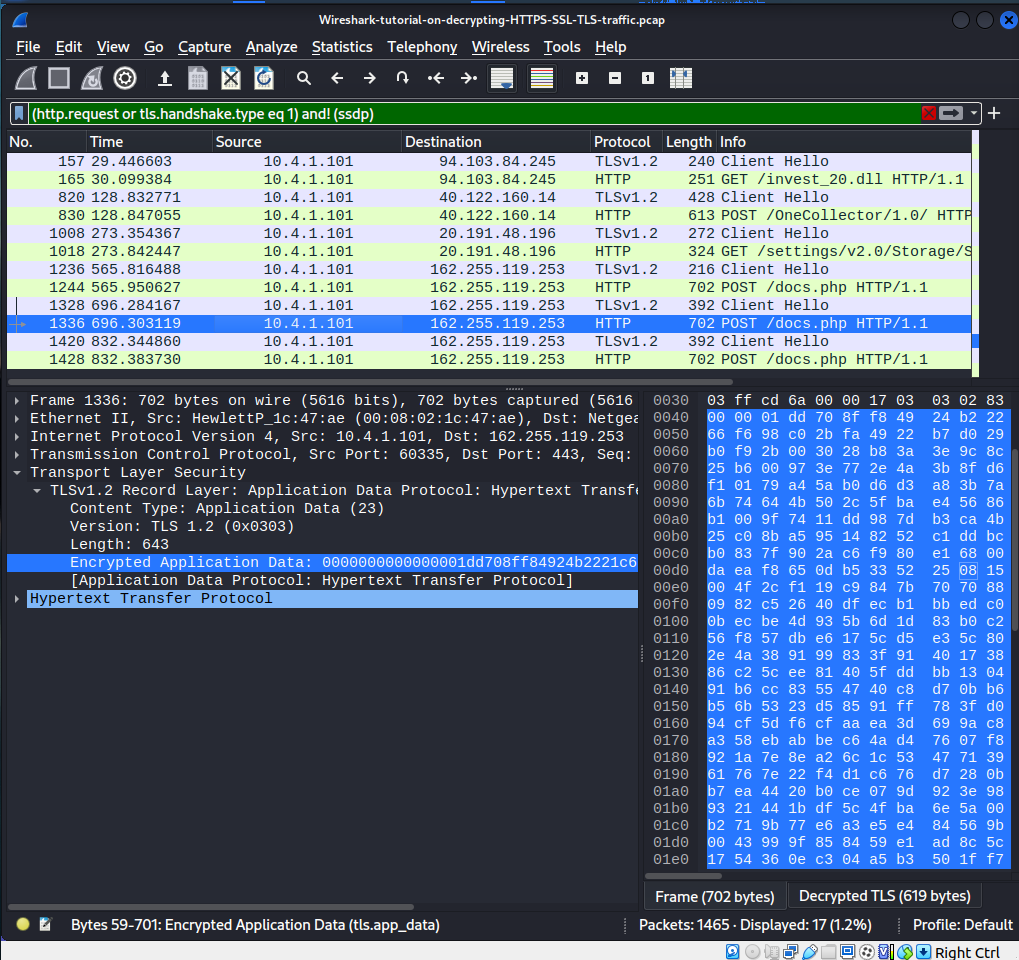
The source port as follows is quite unusual as well to that particular destination ip there to a file called docs.php. It looks like after the infection it connects to the C2 server operated by the hacker. So, if we follow the TLS stream of that particular packet.
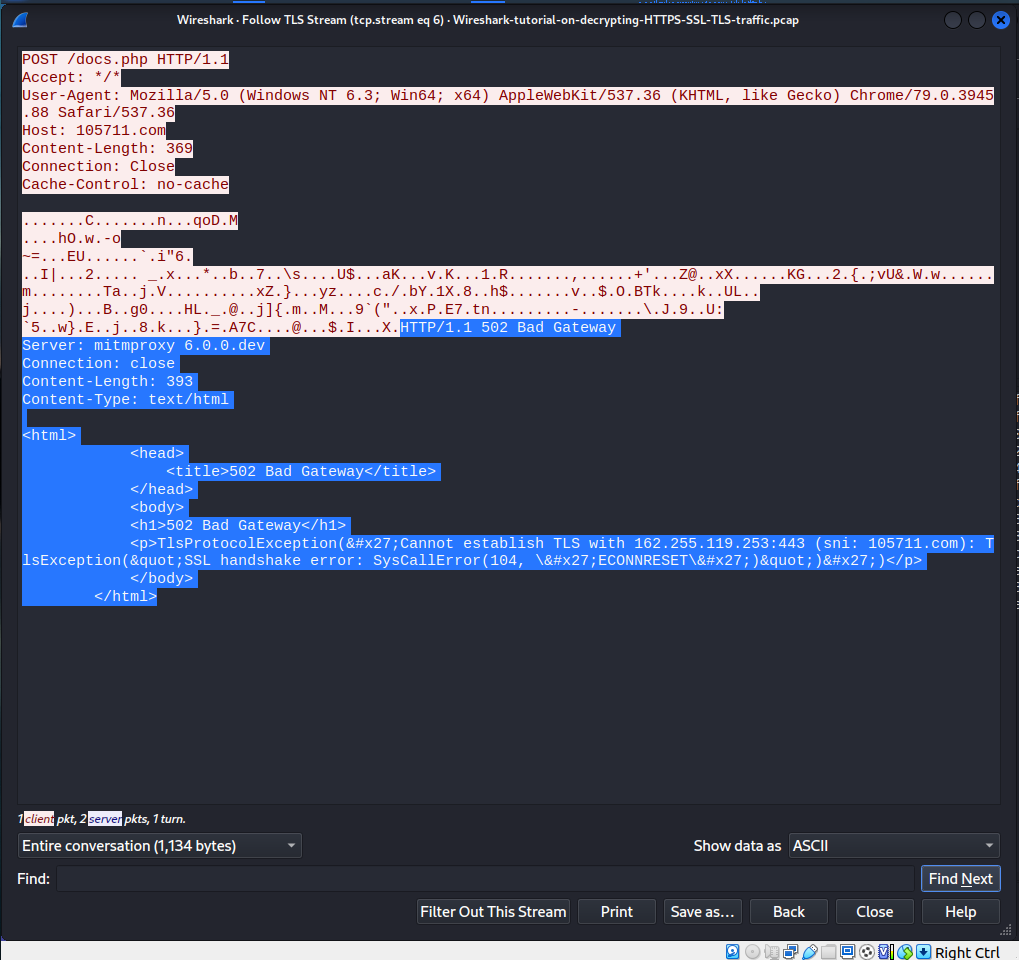
It looks like its the command and control server that is going through the mitmproxy. Now we were able to identify the type of malware and sytem that was infected. If we take a look at the sytem that was infected. If we go back to our our original invest_20.dll file.

We see that the original infected machine is 10.4.1.101. If we take a look at the system that was infected. Lets get rid of our current filter and lets search instead: nbns
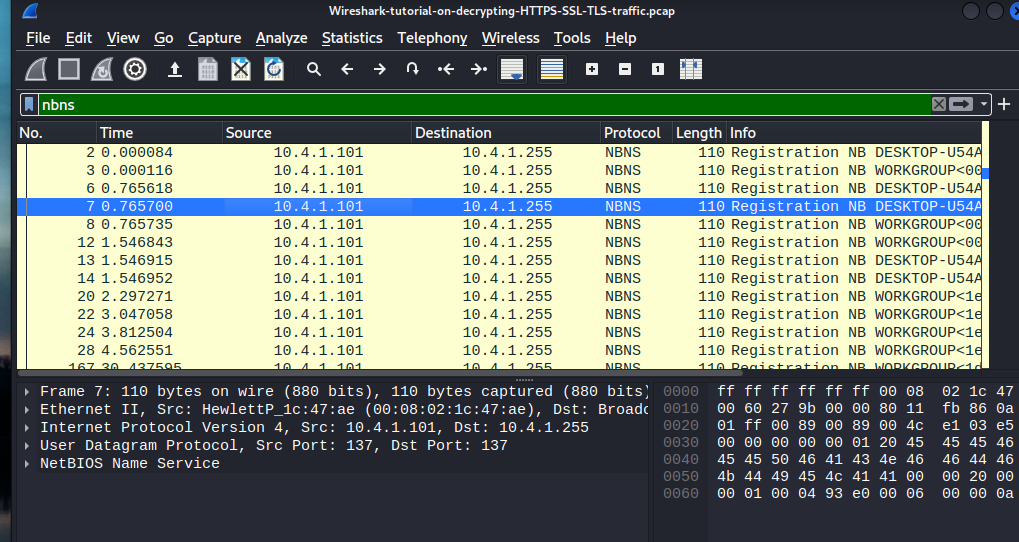
We this search query does is search the host name. The highlighted machine DESKTOP-U54AJ8K we now have a good idea on what system was infected. In the real world we would pass on this information to the Incident Response team or relevant teams to analyze the infected systems. So , that’s is how to utilize wireshark to perform network traffic analysis!
FTP
To demonstrate how FTP packets by capturing the credentials inside of Wireshark. I have created an FTP server. I have opened Wireshark and started capturing on any interface. Now i will login in to the FTP server and put in my inncorrect credentials.

Wireshark will begin to capture this data via packet capturing. Upon opening Wire I search on the filter bar ftp and it should show the packet capture.

We can see the request being made under our user and our passoword is clearly visible in our info section of the packet. If we follow up by following the tcp stream. We can see that it shows the credentials in plain text.

NO BUENO! Ideally we would like to encrypt our login handshake. This comes to show how powerful Wireshark truly is without encryption everything is just out in the open!
Colorization Packets
Different types of packets will have different approaches to analysis. For example associating a certain packet type with a certain color can help you distinguish the different types. Wireshark will load the default color profile but you can customize to your will.
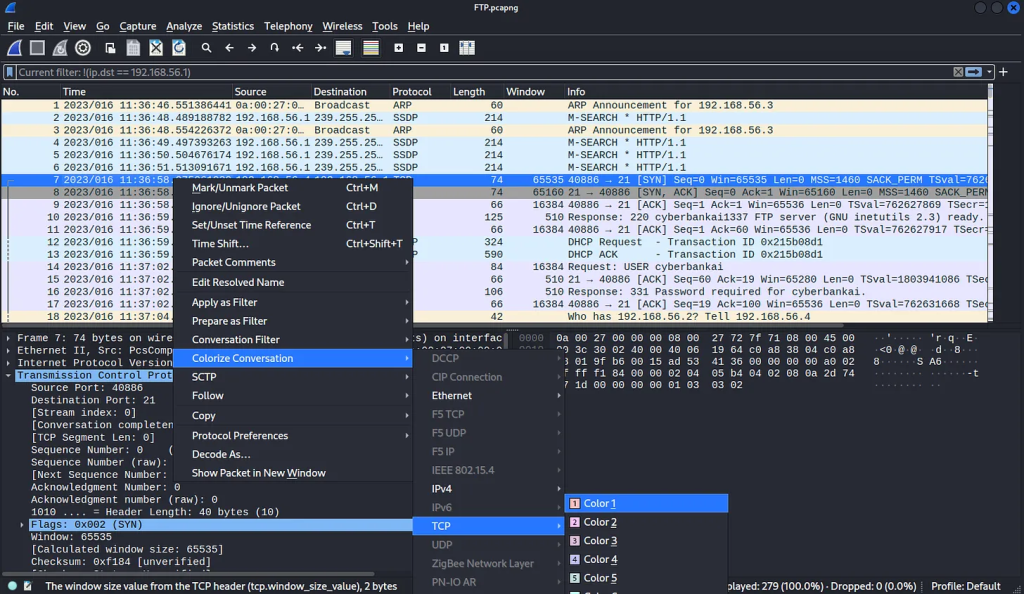
If you right-click a packet you will see an option “Colorize Conversation”, you can select your color from the predefined color list. Selecting any of the colors will change the color for all the matched packets. Because they are not just colors, each color has its own filter.
Now go to View -> Coloring Rules, here you will be able to see all the predefined colors and their filters.
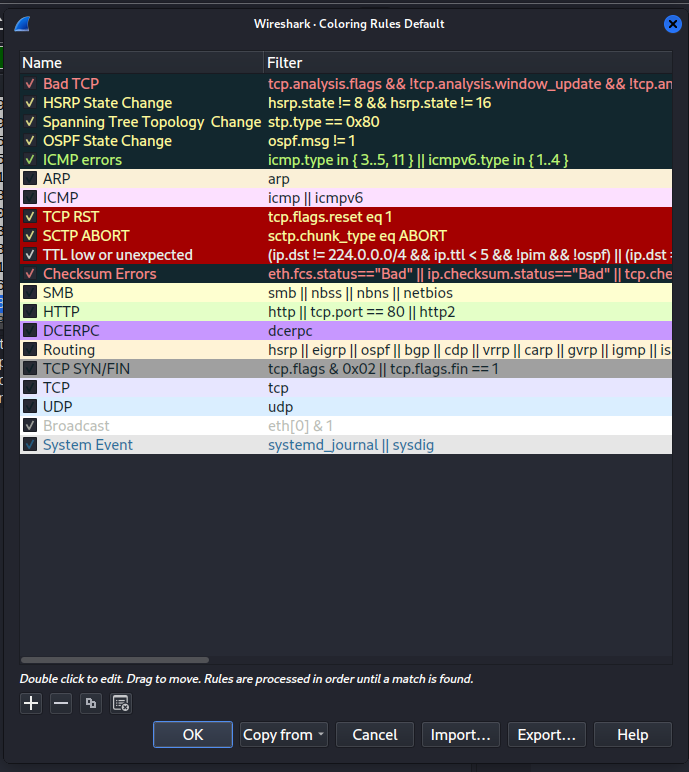
We may Create/Remove/Import/Export any rules we want. Let’s create a new rule that will select packets where the port is 21 (FTP).
Click on the + icon at the bottom left corner, and apply the filter ‘tcp.port ==21’ and hit enter. Now add color to it by clicking on the foreground and background buttons from the bottom. And this will change the color of all packets whose tcp port is 21.
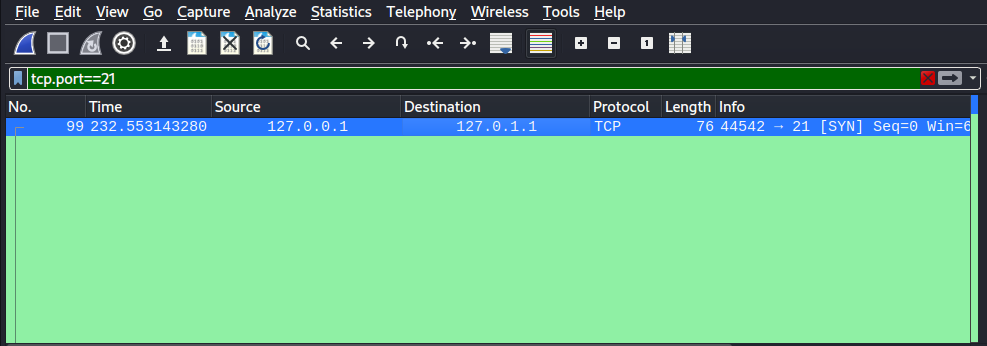
You can improve your packet analysis skills depending on you know yourself. If you can associate your visual prowess with how you read color and can use that talent to your advantage you can be a solid analyst.
Note: If the color is not changing, close and re-open Wireshark and make sure another rule is not overwriting it.
This is it for this Introduction into Wireshark showcasing a simple overview of Wireshark. I hope you enjoyed it as much as I did in creating it. God bless! 🙂


