First let’s start with, what exactly is Suricata?
Suricata is a free and open source threat detection engine. It does this by becoming a IDS, IPS, & network security monitor.
Suricata has two main OPERATIONAL MODES
1. Active (IPS) – Used to alert, log and block network traffic that matches specific rules.
2. Passive (IDS) – Used to identify, alert and log suspicious network traffic within a network.
Suricata IDS Network Placement
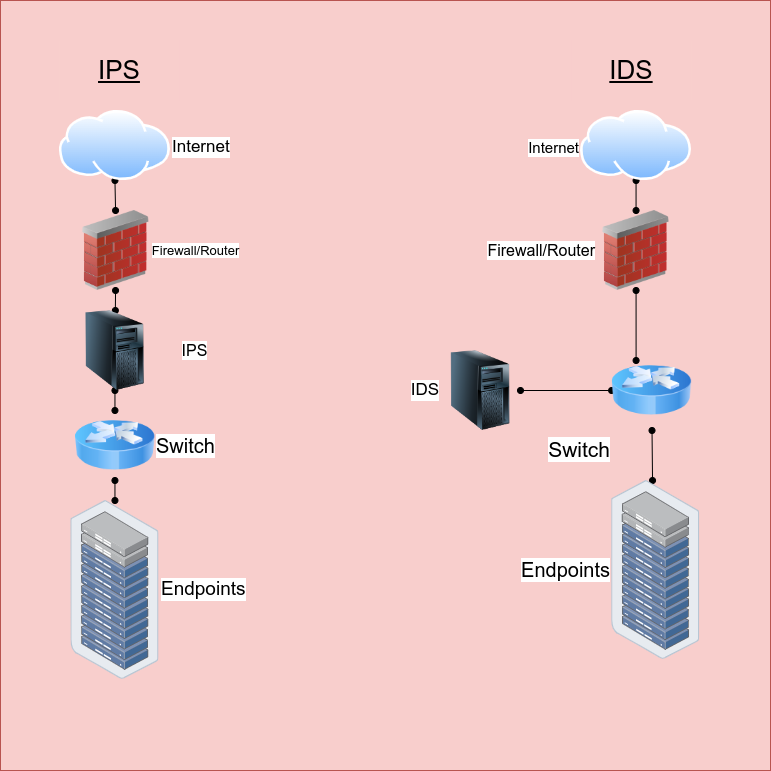
IPS Mode: The connection goes through the router/firewall than on to the IPS. After it’s been checked it will go to the switch and eventually the server endpoints.
IDS Mode: The connection goes through the router/firewall again. This time it will go to the switch. The switch will forward the traffic to the IDS in which it will log the data and eventually it will get to the server endpoints.
Installing Suricata
In our example, we’re going to download suricata onto our Kali box, however, you could also do this on an ubuntu server with a transparent bridge to capture and alert on ALL traffic on a network.
To install suricata, the *best* way is to compile it from source. Since this is a virtual enviroment it should be fine to just use APT. It’s always best practice to run the following command before installing any packages:
sudo apt-get update
To install suriccata run the following command:
sudo apt install suricata -y
At minimum, to run suricata, you need to run it on an interface, but if you run it with no arguments, you’ll get the help page where you’ll see all the options:
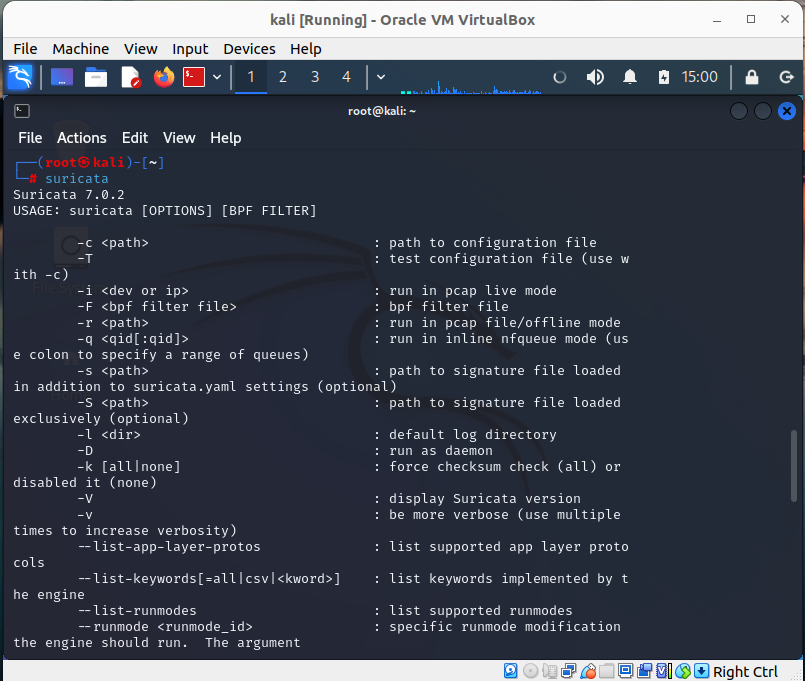
In case you get stuck and need a cheatsheet or guideline on what arguements to use next 🙂
We are going to start off using the /etc/directory to see what we have available for Suricata by typing in /etc/suricata : we should have the directory pulled up now we’re going to type the command: ls
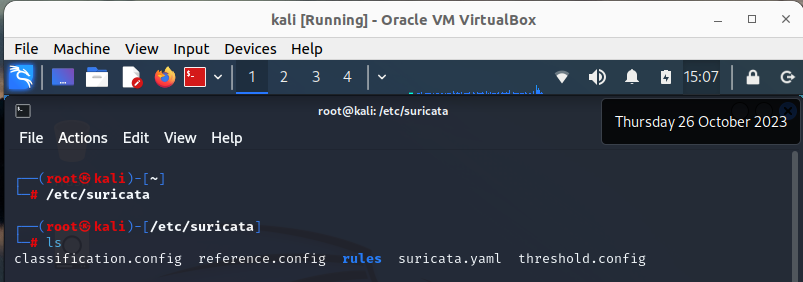
The two that are REALLY IMPORTANT here are the suricata.yaml and the rules directory. The suricata.yaml file is essentially a configuration file. Since, Suricata has so many options, you need to tell it what to do and how to get the best out of it.
After the .yaml file, we have the rules directory ( and its associated file rules in the yaml file). The directory houses the rules that Suricata is going to alert on. Pictured below are the ones Suricata has by default:

The best value Suricata has to offer is writing your own rules and using other people’s rules.
If you want to get Suricata up and running with the default configurations, you run the following command:
suricata –af-packet=eth0

–af-packet is a capture mode and eth0 is just the native interface on the device.
The .yaml file
We’re going to dissect the Suricata YAML file! There’s so much power in Suricata due to its vast array of features, but being able to enable and maximize all of it’s features depends on the configuration of the software. That’s where the YAML file comes into play. So let’s VIM suricata.yaml and see what we see:
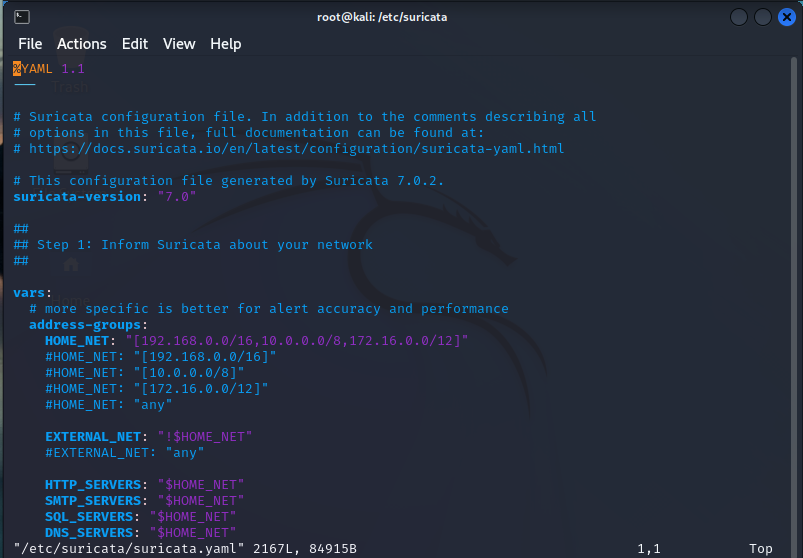
This is only the first 53 of 2167 lines! So, we’re only going to hit the most important aspects. Anything not explicitly mentioned should be researched before adjusting, unless it’s a test machine in which you should be messing around and finding out 😉
So firstly, we can see the $HOME_NET AND $EXTERNAL_NET variables defined. Some rules will use these variables, and surprise, surprise, the home net variables are the RFC-1918 defined internal non-routable IP addresses for the most part.
Section 2:
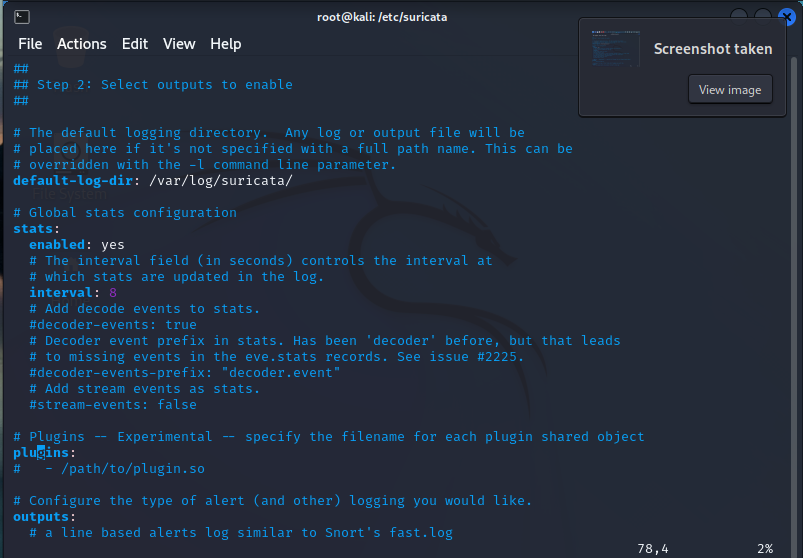
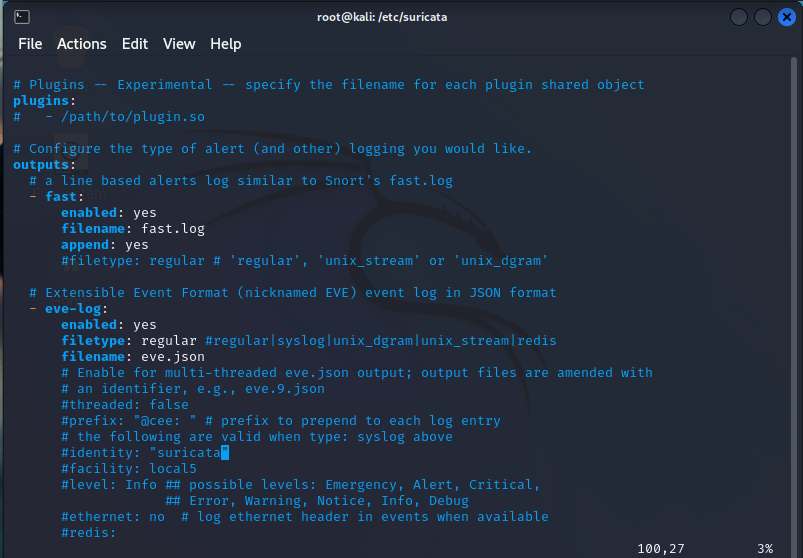
Here we won’t be editing anything , but I want you to see what’s going on here. There’s the fast.log and the eve.log. The fast.log is a brief overview of alerts while the eve.log is a complete capture of network traffic metadata stored in the JSON format.
Notice that there are a bunch of things commented out. These are features you can enable if it suits your enviroment but, it’s not necessary to know or how to implement them.
Next, we’ll jump to line 151. We will be seeing the types of traffic we’ll be viewing, categorizing, and generating alerts on.
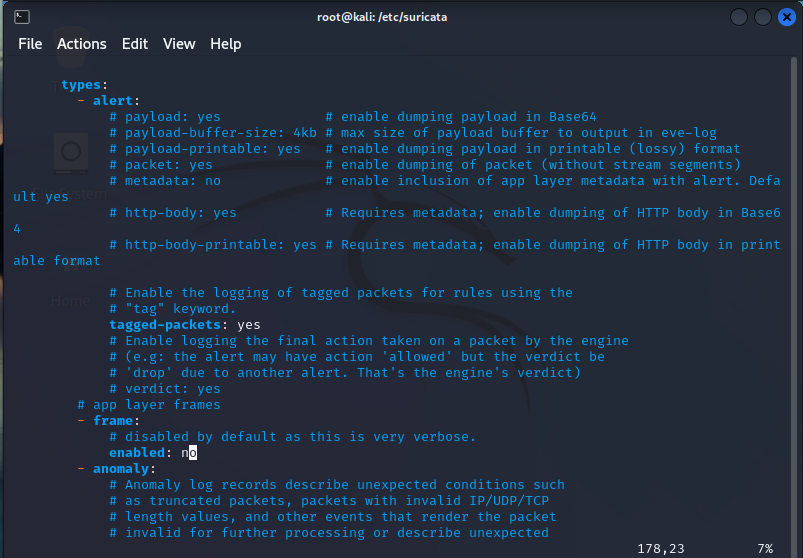
A little further down, we can see that there is this large list – essentially, this will identify these types of traffic in the flows, documents and alerts:
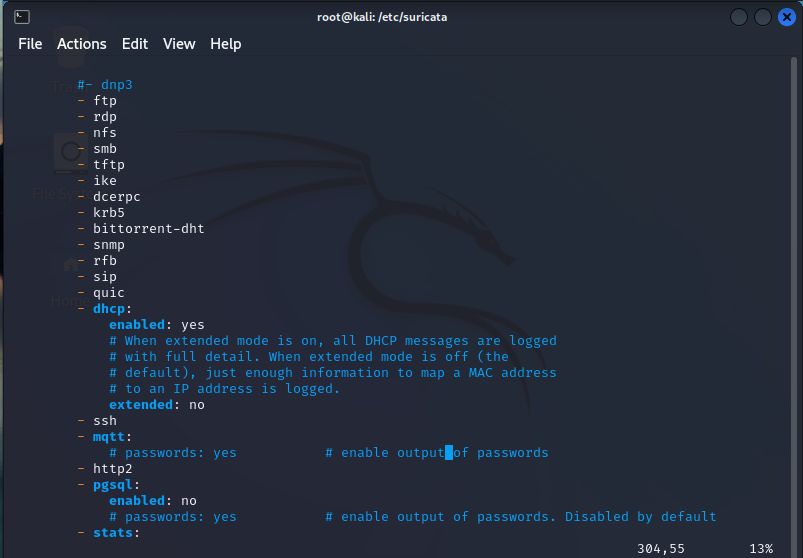
Similarly, we have some like “ssh” and “http” that will give more options for what types of characteristics of the traffic will be monitrored and recorded, and this will vary on a protocol by protocol basis.
On line 333 we have logs:
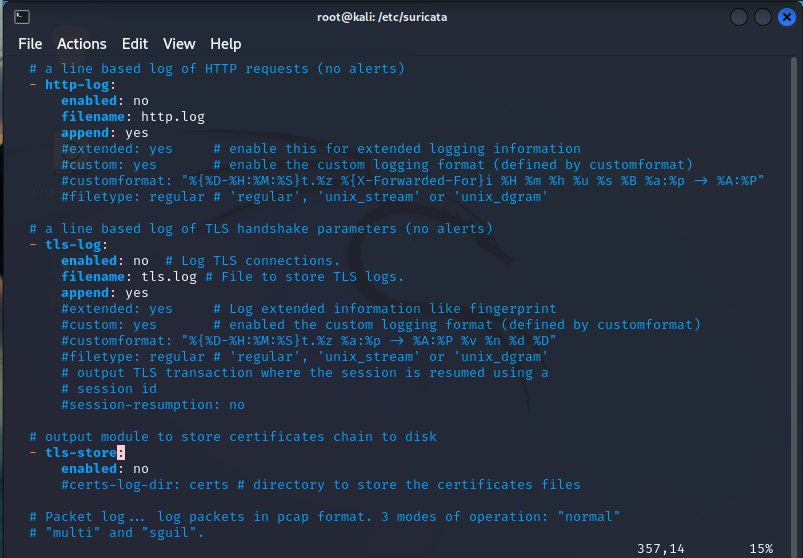
Suricata has a lot options to store logs on lots of different types of traffic. These are cool but have some disadvantages:
- They take up disk space
- They reduce performance
So, if you feel you need them, remember there’s a significant tradeoff.
Let’s jump to line 587:
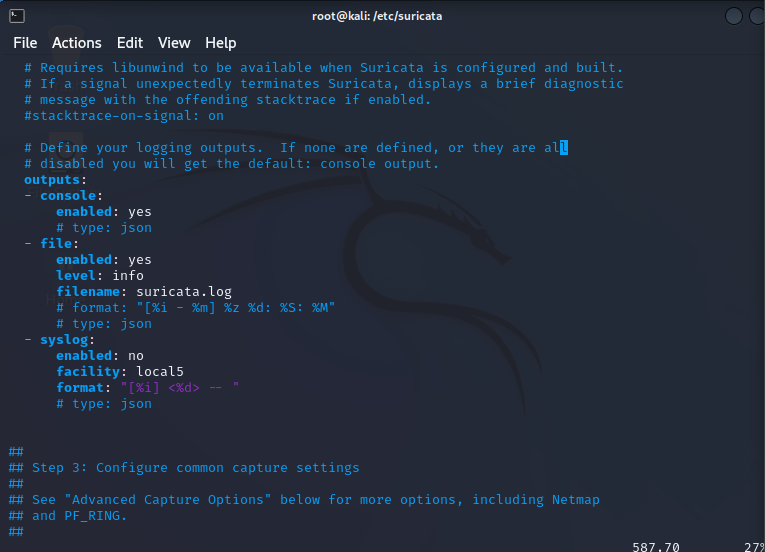
There are a bunch of logging options available to choose from. The console logging and file logging are standard. The console being the info displayed when running it from the command line and surucata.log file being what’s saved to the log file.
We now move to Section 3 on line 607 and find out how we can configure out capture methods:
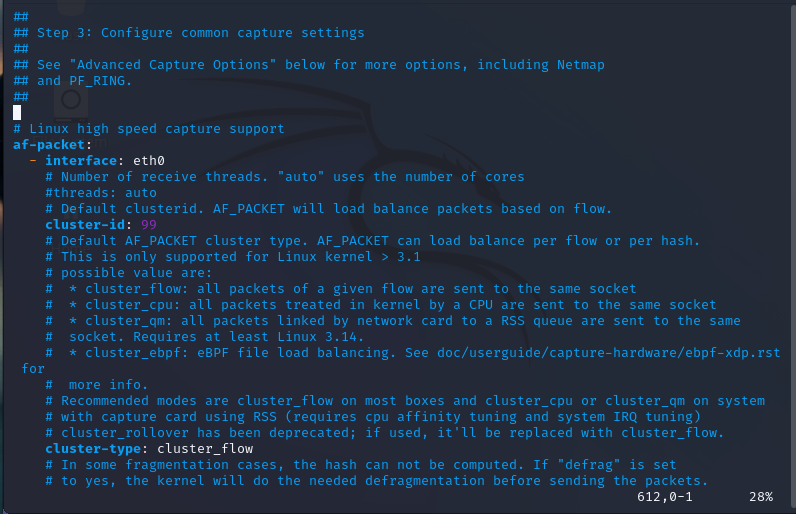
We are going to leave everything as is. This area can be configured to make our default modes incredibly efficient for capturing network traffic.
On line 852, we now see the application layer protocols and the breakdowns of those as such.
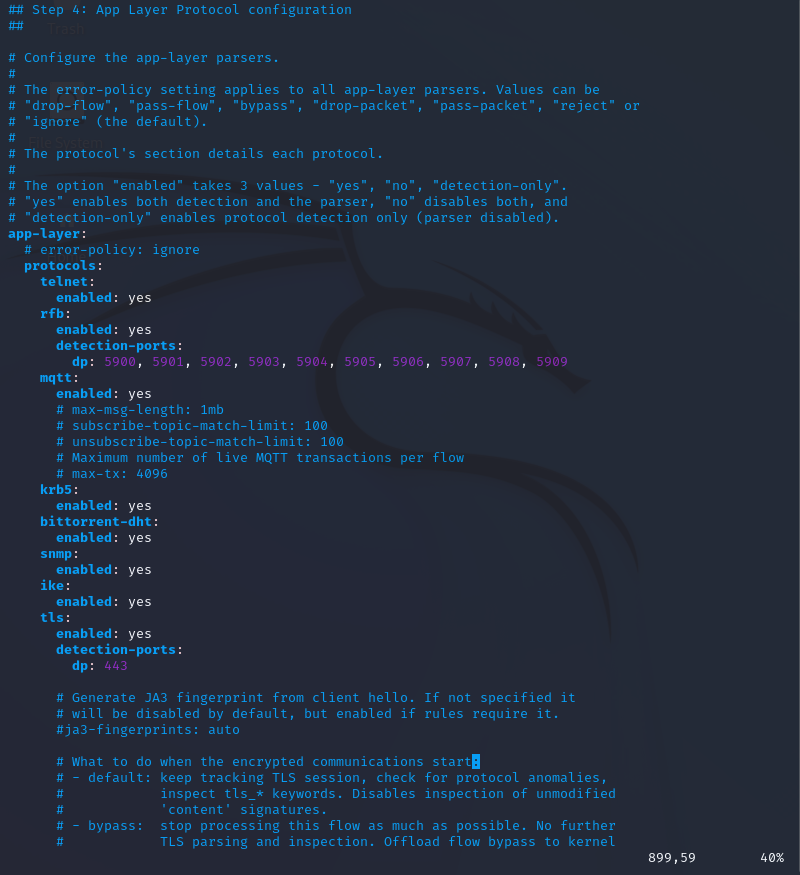
They are going to be used in rules that specify protocols like TLS, SNMP, Telnet, etc.
Once we go to line 1183, we end up having 1000 lines of “Advanced Settings”
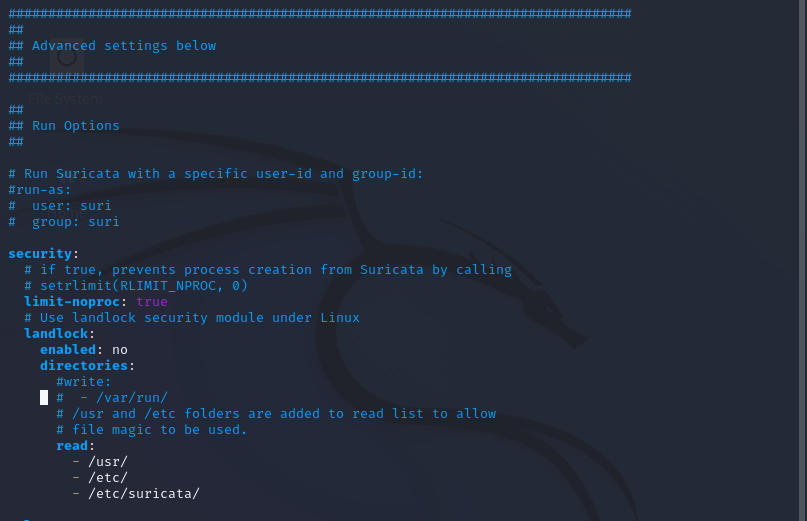
The most important setting we need to touch on is – the rule file
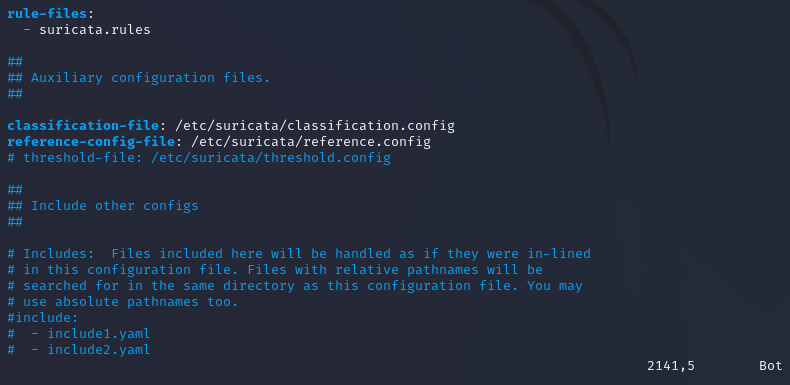
This outlines what rules are going to be parsed. The only other advanced settings we should be aware of are the memcap settings that are scattered throughout the file, also the CPU thread ratio. In the event you experience performance issues, these are values that can be adjusted up or down but would require a lot of tinkering with, and shouldn’t be an issue in this day and age in your small or enterprise organization as CPUs have become incredibly powerful. That’s all for this one folks next we are going to make a lab using Sirucata to customize our own rules and generate custom alerts via our SIEM. Stay tuned 😀 god bless!
The .yaml file
We’re going to dissect the Suricata YAML file! There’s so much power in Suricata due to its vast array of features, but being able to enable and maximize all of it’s features depends on the configuration of the software. That’s where the YAML file comes into play. So let’s VIM suricata.yaml and see what we see:

This is only the first 53 of 2167 lines! So, we’re only going to hit the most important aspects. Anything not explicitly mentioned should be researched before adjusting, unless it’s a test machine in which you should be messing around and finding out 😉
So firstly, we can see the $HOME_NET AND $EXTERNAL_NET variables defined. Some rules will use these variables, and surprise, surprise, the home net variables are the RFC-1918 defined internal non-routable IP addresses for the most part.
Section 2:


Here we won’t be editing anything , but I want you to see what’s going on here. There’s the fast.log and the eve.log. The fast.log is a brief overview of alerts while the eve.log is a complete capture of network traffic metadata stored in the JSON format.
Notice that there are a bunch of things commented out. These are features you can enable if it suits your enviroment but, it’s not necessary to know or how to implement them.
Next, we’ll jump to line 151. We will be seeing the types of traffic we’ll be viewing, categorizing, and generating alerts on.

A little further down, we can see that there is this large list – essentially, this will identify these types of traffic in the flows, documents and alerts:

Similarly, we have some like “ssh” and “http” that will give more options for what types of characteristics of the traffic will be monitrored and recorded, and this will vary on a protocol by protocol basis.
On line 333 we have logs:

Suricata has a lot options to store logs on lots of different types of traffic. These are cool but have some disadvantages:
- They take up disk space
- They reduce performance
So, if you feel you need them, remember there’s a significant tradeoff.
Let’s jump to line 587:

There are a bunch of logging options available to choose from. The console logging and file logging are standard. The console being the info displayed when running it from the command line and surucata.log file being what’s saved to the log file.
We now move to Section 3 on line 607 and find out how we can configure out capture methods:

We are going to leave everything as is. This area can be configured to make our default modes incredibly efficient for capturing network traffic.
On line 852, we now see the application layer protocols and the breakdowns of those as such.

They are going to be used in rules that specify protocols like TLS, SNMP, Telnet, etc.
Once we go to line 1183, we end up having 1000 lines of “Advanced Settings”

The most important setting we need to touch on is – the rule file

This outlines what rules are going to be parsed. The only other advanced settings we should be aware of are the memcap settings that are scattered throughout the file, also the CPU thread ratio. In the event you experience performance issues, these are values that can be adjusted up or down but would require a lot of tinkering with, and shouldn’t be an issue in this day and age in your small or enterprise organization as CPUs have become incredibly powerful. That’s all for this one folks next we are going to make a lab using Sirucata to customize our own rules and generate custom alerts via our SIEM. Stay tuned 😀 god bless!
The .yaml file
The .yaml file
We’re going to dissect the Suricata YAML file! There’s so much power in Suricata due to its vast array of features, but being able to enable and maximize all of it’s features depends on the configuration of the software. That’s where the YAML file comes into play. So let’s VIM suricata.yaml and see what we see:

This is only the first 53 of 2167 lines! So, we’re only going to hit the most important aspects. Anything not explicitly mentioned should be researched before adjusting, unless it’s a test machine in which you should be messing around and finding out 😉
So firstly, we can see the $HOME_NET AND $EXTERNAL_NET variables defined. Some rules will use these variables, and surprise, surprise, the home net variables are the RFC-1918 defined internal non-routable IP addresses for the most part.
Section 2:


Here we won’t be editing anything , but I want you to see what’s going on here. There’s the fast.log and the eve.log. The fast.log is a brief overview of alerts while the eve.log is a complete capture of network traffic metadata stored in the JSON format.
Notice that there are a bunch of things commented out. These are features you can enable if it suits your enviroment but, it’s not necessary to know or how to implement them.
Next, we’ll jump to line 151. We will be seeing the types of traffic we’ll be viewing, categorizing, and generating alerts on.

A little further down, we can see that there is this large list – essentially, this will identify these types of traffic in the flows, documents and alerts:

Similarly, we have some like “ssh” and “http” that will give more options for what types of characteristics of the traffic will be monitrored and recorded, and this will vary on a protocol by protocol basis.
On line 333 we have logs:

Suricata has a lot options to store logs on lots of different types of traffic. These are cool but have some disadvantages:
- They take up disk space
- They reduce performance
So, if you feel you need them, remember there’s a significant tradeoff.
Let’s jump to line 587:

There are a bunch of logging options available to choose from. The console logging and file logging are standard. The console being the info displayed when running it from the command line and surucata.log file being what’s saved to the log file.
We now move to Section 3 on line 607 and find out how we can configure out capture methods:

We are going to leave everything as is. This area can be configured to make our default modes incredibly efficient for capturing network traffic.
On line 852, we now see the application layer protocols and the breakdowns of those as such.

They are going to be used in rules that specify protocols like TLS, SNMP, Telnet, etc.
Once we go to line 1183, we end up having 1000 lines of “Advanced Settings”

The most important setting we need to touch on is – the rule file

This outlines what rules are going to be parsed. The only other advanced settings we should be aware of are the memcap settings that are scattered throughout the file, also the CPU thread ratio. In the event you experience performance issues, these are values that can be adjusted up or down but would require a lot of tinkering with, and shouldn’t be an issue in this day and age in your small or enterprise organization as CPUs have become incredibly powerful. That’s all for this one folks next we are going to make a lab using Sirucata to customize our own rules and generate custom alerts via our SIEM. Stay tuned 😀 god bless!
We’re going to dissect the Suricata YAML file! There’s so much power in Suricata due to its vast array of features, but being able to enable and maximize all of it’s features depends on the configuration of the software. That’s where the YAML file comes into play. So let’s VIM suricata.yaml and see what we see:

This is only the first 53 of 2167 lines! So, we’re only going to hit the most important aspects. Anything not explicitly mentioned should be researched before adjusting, unless it’s a test machine in which you should be messing around and finding out 😉
So firstly, we can see the $HOME_NET AND $EXTERNAL_NET variables defined. Some rules will use these variables, and surprise, surprise, the home net variables are the RFC-1918 defined internal non-routable IP addresses for the most part.
Section 2:


Here we won’t be editing anything , but I want you to see what’s going on here. There’s the fast.log and the eve.log. The fast.log is a brief overview of alerts while the eve.log is a complete capture of network traffic metadata stored in the JSON format.
Notice that there are a bunch of things commented out. These are features you can enable if it suits your enviroment but, it’s not necessary to know or how to implement them.
Next, we’ll jump to line 151. We will be seeing the types of traffic we’ll be viewing, categorizing, and generating alerts on.

A little further down, we can see that there is this large list – essentially, this will identify these types of traffic in the flows, documents and alerts:

Similarly, we have some like “ssh” and “http” that will give more options for what types of characteristics of the traffic will be monitrored and recorded, and this will vary on a protocol by protocol basis.
On line 333 we have logs:

Suricata has a lot options to store logs on lots of different types of traffic. These are cool but have some disadvantages:
- They take up disk space
- They reduce performance
So, if you feel you need them, remember there’s a significant tradeoff.
Let’s jump to line 587:

There are a bunch of logging options available to choose from. The console logging and file logging are standard. The console being the info displayed when running it from the command line and surucata.log file being what’s saved to the log file.
We now move to Section 3 on line 607 and find out how we can configure out capture methods:

We are going to leave everything as is. This area can be configured to make our default modes incredibly efficient for capturing network traffic.
On line 852, we now see the application layer protocols and the breakdowns of those as such.

They are going to be used in rules that specify protocols like TLS, SNMP, Telnet, etc.
Once we go to line 1183, we end up having 1000 lines of “Advanced Settings”

The most important setting we need to touch on is – the rule file

This outlines what rules are going to be parsed. The only other advanced settings we should be aware of are the memcap settings that are scattered throughout the file, also the CPU thread ratio. In the event you experience performance issues, these are values that can be adjusted up or down but would require a lot of tinkering with, and shouldn’t be an issue in this day and age in your small or enterprise organization as CPUs have become incredibly powerful. That’s all for this one folks next we are going to make a lab using Sirucata to customize our own rules and generate custom alerts via our SIEM. Stay tuned 😀 god bless!
The .yaml file
We’re going to dissect the Suricata YAML file! There’s so much power in Suricata due to its vast array of features, but being able to enable and maximize all of it’s features depends on the configuration of the software. That’s where the YAML file comes into play. So let’s VIM suricata.yaml and see what we see:

This is only the first 53 of 2167 lines! So, we’re only going to hit the most important aspects. Anything not explicitly mentioned should be researched before adjusting, unless it’s a test machine in which you should be messing around and finding out 😉
So firstly, we can see the $HOME_NET AND $EXTERNAL_NET variables defined. Some rules will use these variables, and surprise, surprise, the home net variables are the RFC-1918 defined internal non-routable IP addresses for the most part.
Section 2:


Here we won’t be editing anything , but I want you to see what’s going on here. There’s the fast.log and the eve.log. The fast.log is a brief overview of alerts while the eve.log is a complete capture of network traffic metadata stored in the JSON format.
Notice that there are a bunch of things commented out. These are features you can enable if it suits your enviroment but, it’s not necessary to know or how to implement them.
Next, we’ll jump to line 151. We will be seeing the types of traffic we’ll be viewing, categorizing, and generating alerts on.

A little further down, we can see that there is this large list – essentially, this will identify these types of traffic in the flows, documents and alerts:

Similarly, we have some like “ssh” and “http” that will give more options for what types of characteristics of the traffic will be monitrored and recorded, and this will vary on a protocol by protocol basis.
On line 333 we have logs:

Suricata has a lot options to store logs on lots of different types of traffic. These are cool but have some disadvantages:
- They take up disk space
- They reduce performance
So, if you feel you need them, remember there’s a significant tradeoff.
Let’s jump to line 587:

There are a bunch of logging options available to choose from. The console logging and file logging are standard. The console being the info displayed when running it from the command line and surucata.log file being what’s saved to the log file.
We now move to Section 3 on line 607 and find out how we can configure out capture methods:

We are going to leave everything as is. This area can be configured to make our default modes incredibly efficient for capturing network traffic.
On line 852, we now see the application layer protocols and the breakdowns of those as such.

They are going to be used in rules that specify protocols like TLS, SNMP, Telnet, etc.
Once we go to line 1183, we end up having 1000 lines of “Advanced Settings”

The most important setting we need to touch on is – the rule file

This outlines what rules are going to be parsed. The only other advanced settings we should be aware of are the memcap settings that are scattered throughout the file, also the CPU thread ratio. In the event you experience performance issues, these are values that can be adjusted up or down but would require a lot of tinkering with, and shouldn’t be an issue in this day and age in your small or enterprise organization as CPUs have become incredibly powerful. That’s all for this one folks next we are going to make a lab using Sirucata to customize our own rules and generate custom alerts via our SIEM. Stay tuned 😀 god bless!
The .yaml file
We’re going to dissect the Suricata YAML file! There’s so much power in Suricata due to its vast array of features, but being able to enable and maximize all of it’s features depends on the configuration of the software. That’s where the YAML file comes into play. So let’s VIM suricata.yaml and see what we see:

This is only the first 53 of 2167 lines! So, we’re only going to hit the most important aspects. Anything not explicitly mentioned should be researched before adjusting, unless it’s a test machine in which you should be messing around and finding out 😉
So firstly, we can see the $HOME_NET AND $EXTERNAL_NET variables defined. Some rules will use these variables, and surprise, surprise, the home net variables are the RFC-1918 defined internal non-routable IP addresses for the most part.
Section 2:


Here we won’t be editing anything , but I want you to see what’s going on here. There’s the fast.log and the eve.log. The fast.log is a brief overview of alerts while the eve.log is a complete capture of network traffic metadata stored in the JSON format.
Notice that there are a bunch of things commented out. These are features you can enable if it suits your enviroment but, it’s not necessary to know or how to implement them.
Next, we’ll jump to line 151. We will be seeing the types of traffic we’ll be viewing, categorizing, and generating alerts on.

A little further down, we can see that there is this large list – essentially, this will identify these types of traffic in the flows, documents and alerts:

Similarly, we have some like “ssh” and “http” that will give more options for what types of characteristics of the traffic will be monitrored and recorded, and this will vary on a protocol by protocol basis.
On line 333 we have logs:

Suricata has a lot options to store logs on lots of different types of traffic. These are cool but have some disadvantages:
- They take up disk space
- They reduce performance
So, if you feel you need them, remember there’s a significant tradeoff.
Let’s jump to line 587:

There are a bunch of logging options available to choose from. The console logging and file logging are standard. The console being the info displayed when running it from the command line and surucata.log file being what’s saved to the log file.
We now move to Section 3 on line 607 and find out how we can configure out capture methods:

We are going to leave everything as is. This area can be configured to make our default modes incredibly efficient for capturing network traffic.
On line 852, we now see the application layer protocols and the breakdowns of those as such.

They are going to be used in rules that specify protocols like TLS, SNMP, Telnet, etc.
Once we go to line 1183, we end up having 1000 lines of “Advanced Settings”

The most important setting we need to touch on is – the rule file

This outlines what rules are going to be parsed. The only other advanced settings we should be aware of are the memcap settings.
That is all for now folks , next we’re going to be talking about the ins and outs of the .yaml file next 🙂 god bless my friends!


